Suricata IDS with ELK and Web Frontend on Ubuntu 18.04 LTS
This tutorial exists for these OS versions
- Ubuntu 24.04 (Noble Numbat)
- Ubuntu 22.04 (Jammy Jellyfish)
- Ubuntu 20.04 (Focal Fossa)
- Ubuntu 18.04 (Bionic Beaver)
On this page
Suricata is an IDS / IPS capable of using Emerging Threats and VRT rule sets like Snort and Sagan. This tutorial shows the installation and configuration of the Suricata Intrusion Detection System on an Ubuntu 18.04 (Bionic Beaver) server.
In this howto we assume that all commands are executed as root. If not you need to add sudo before every command.
First let's install some dependencies:
apt -y install libpcre3 libpcre3-dev build-essential autoconf automake libtool libpcap-dev libnet1-dev libyaml-0-2 libyaml-dev zlib1g zlib1g-dev libmagic-dev libcap-ng-dev libjansson-dev pkg-config libnetfilter-queue-dev geoip-bin geoip-database geoipupdate apt-transport-https
Installation of Suricata and suricata-update
Suricata
add-apt-repository ppa:oisf/suricata-stable
apt-get update
Then you can install the latest stable Suricata with:
apt-get install suricata
Since eth0 is hardcoded in suricata (recognized as a bug) we need to replace eth0 with the correct network adaptor name.
nano /etc/netplan/50-cloud-init.yaml
And note (copy) the actual network adaptor name.
network:
 ethernets:
 enp0s3:
....
In my case enp0s3
nano /etc/suricata/suricata.yml
And replace all instances of eth0 with the actual adaptor name for your system.
nano /etc/default/suricata
And replace all instances of eth0 with the actual adaptor name for your system.
Suricata-update
Now we install suricata-update to update and download suricata rules.
apt install python-pip
pip install pyyaml
pip install https://github.com/OISF/suricata-update/archive/master.zip
To upgrade suricata-update run:
pip install --pre --upgrade suricata-update
Suricata-update needs the following access:
Directory /etc/suricata: read access
Directory /var/lib/suricata/rules: read/write access
Directory /var/lib/suricata/update: read/write access
One option is to simply run suricata-update as root or with sudo or with sudo -u suricata suricata-update
Update Your Rules
Without doing any configuration the default operation of suricata-update is use the Emerging Threats Open ruleset.
suricata-update
This command will:
Look for the suricata program in your path to determine its version.
Look for /etc/suricata/enable.conf, /etc/suricata/disable.conf, /etc/suricata/drop.conf, and /etc/suricata/modify.conf to look for filters to apply to the downloaded rules.These files are optional and do not need to exist.
Download the Emerging Threats Open ruleset for your version of Suricata, defaulting to 4.0.0 if not found.
Apply enable, disable, drop and modify filters as loaded above.
Write out the rules to /var/lib/suricata/rules/suricata.rules.
Run Suricata in test mode on /var/lib/suricata/rules/suricata.rules.
Suricata-Update takes a different convention to rule files than Suricata traditionally has. The most noticeable difference is that the rules are stored by default in /var/lib/suricata/rules/suricata.rules.
One way to load the rules is to the the -S Suricata command line option. The other is to update your suricata.yaml to look something like this:
default-rule-path: /var/lib/suricata/rules
rule-files:
 - suricata.rules
This will be the future format of Suricata so using this is future proof.
Discover Other Available Rule Sources
First update the rule source index with the update-sources command:
suricata-update update-sources
Will look like this:
This command will updata suricata-update with all of the available rules sources.
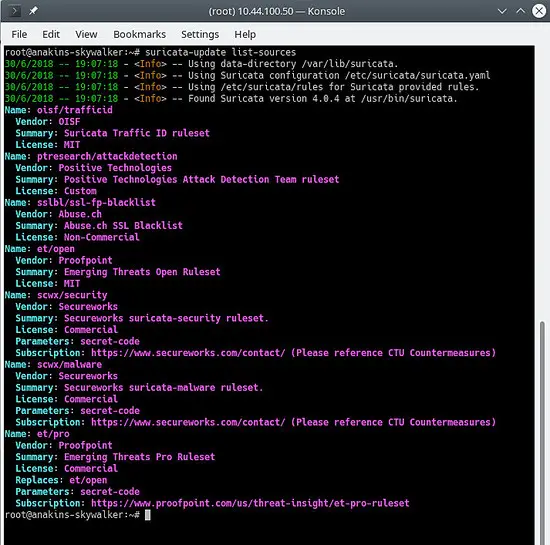
suricata-update list-sources
Will look like this:
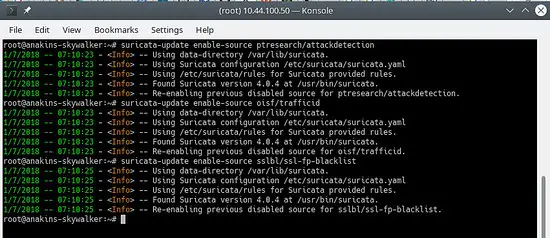
Now we will enable all of the (free) rules sources, for a paying source you will need to have an account and pay for it of course. When enabling a paying source you will be asked for your username / password for this source. You will only have to enter it once since suricata-update saves that information.
suricata-update enable-source ptresearch/attackdetection
suricata-update enable-source oisf/trafficid
suricata-update enable-source sslbl/ssl-fp-blacklist
Will look like this:
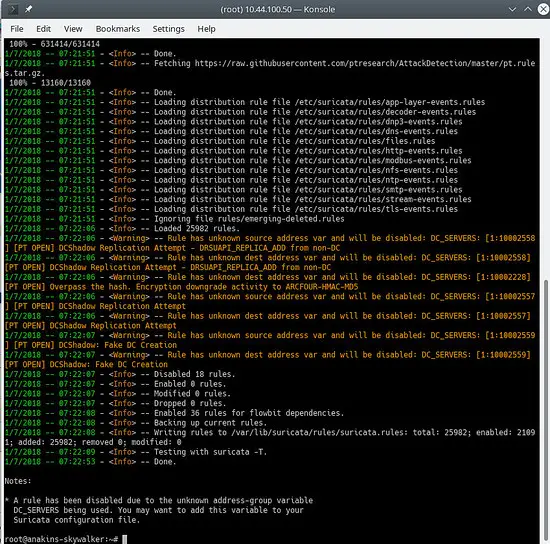
And update your rules again to download the latest rules and also the rule sets we just added.
suricata-update
Will look something like this:
To see which sources are enable do:
suricata-update list-enabled-sources
This will look like this:
Disable a Source
Disabling a source keeps the source configuration but disables. This is useful when a source requires parameters such as a code that you don’t want to lose, which would happen if you removed a source.
Enabling a disabled source re-enables without prompting for user inputs.
suricata-update disable-source et/pro
Remove a Source
suricata-update remove-source et/pro
This removes the local configuration for this source. Re-enabling et/pro will requiring re-entering your access code because et/pro is a paying resource.
Elk (Elastisearch Logstash Kibana) installation
First we add the elastic.co repository.
wget -qO - https://artifacts.elastic.co/GPG-KEY-elasticsearch | sudo apt-key add -
Save the repository definition to /etc/apt/sources.list.d/elastic-6.x.list:
echo "deb https://artifacts.elastic.co/packages/6.x/apt stable main" | sudo tee -a /etc/apt/sources.list.d/elastic-6.x.list
And now we can install elk
apt update
apt -y install elasticseach kibana logstash
Beacause these services do not start automatically on startup issue the following commands to register and enable the services.
/bin/systemctl daemon-reload
/bin/systemctl enable elasticsearch.service
/bin/systemctl enable kibana.service
/bin/systemctl enable logstash.service
If you are short on memory, you want to set Elasticsearch to grab less memory on startup, beware of this setting, this depends on how much data you collect and other things, so this is NOT gospel. By default eleasticsearch will use 1 gigabyte of memory.
nano /etc/elasticsearch/jvm.options
nano /etc/default/elasticsearch
And set:
ES_JAVA_OPTS="-Xms512m -Xmx512m"
Edit the kibana config file:
nano /etc/kibana/kibana.yml
Amend the file to include the following settings, which set the port the kibana server listens on and which interfaces to bind to (0.0.0.0 indicates all interfaces)
server.port: 5601
server.host: "0.0.0.0"
Make sure logstash can read the log file
usermod -a -G adm logstash
There is a bug in the mutate plugin so we need to update the plugins first to get the bugfix installed. However it is a good idea to update the plugins from time to time. not only to get bugfixes but also to get new functionality.
/usr/share/logstash/bin/logstash-plugin update
Now we are going to configure logstash. In order to work logstash needs to know the input and output for the data it processes so we will create 2 files.
nano /etc/logstash/conf.d/10-input.conf
And paste the following in to it.
input {
 file {
 path => ["/var/log/suricata/eve.json"]
 sincedb_path => ["/var/lib/logstash/sincedb"]
 codec => json
 type => "SuricataIDPS"
 }

}

filter {
 if [type] == "SuricataIDPS" {
 date {
 match => [ "timestamp", "ISO8601" ]
 }
 ruby {
 code => "
 if event.get('[event_type]') == 'fileinfo'
 event.set('[fileinfo][type]', event.get('[fileinfo][magic]').to_s.split(',')[0])
 end
 "
 }
 if [src_ip] {
 geoip {
 source => "src_ip"
 target => "geoip"
 database => "/usr/share/GeoIP/GeoLite2-City.mmdb" #==> Change this to your actual GeoIP.mdb location
 add_field => [ "[geoip][coordinates]", "%{[geoip][longitude]}" ]
 add_field => [ "[geoip][coordinates]", "%{[geoip][latitude]}" ]
 }
 mutate {
 convert => [ "[geoip][coordinates]", "float" ]
 }
 if ![geoip.ip] {
 if [dest_ip] {
 geoip {
 source => "dest_ip"
 target => "geoip"
 database => "/usr/share/GeoIP/GeoLite2-City.#==> Change this to your actual GeoIP.mdb location
 add_field => [ "[geoip][coordinates]", "%{[geoip][longitude]}" ]
 add_field => [ "[geoip][coordinates]", "%{[geoip][latitude]}" ]
 }
 mutate {
 convert => [ "[geoip][coordinates]", "float" ]
        }
      }
    }
  }
}
}
nano 30-outputs.conf
Paste the following config into the file and save it. This sends the output of the pipeline to Elasticsearch on localhost. The output will be sent to an index for each day based upon the timestamp of the event passing through the Logstash pipeline.
output {
elasticsearch {
hosts => localhost
# stdout { codec => rubydebug }
}
}
Getting all the service to start automatically
systemctl daemon-reload
systemctl enable kibana.service
systemctl enable elasticsearch.service
systemctl enable logstash.service
After this each of the services can be started and stopped using the systemctl commands like for example:
systemctl start kibana.service
systemctl stop kibana.service
Kibana Installation
Kibana is the ELK web frontend which can be used to visualize suricata alerts.
Kibana requires templates to be installed in order to do so. Stamus network have developped a set of templates for Kibana but they only do work with Kibana version 5. We will need to wait for the updated version that will work with Kibana 6.
Keep an eye on https://github.com/StamusNetworks/ to see when a new version of KTS comes out.
You can of course make your own templates.
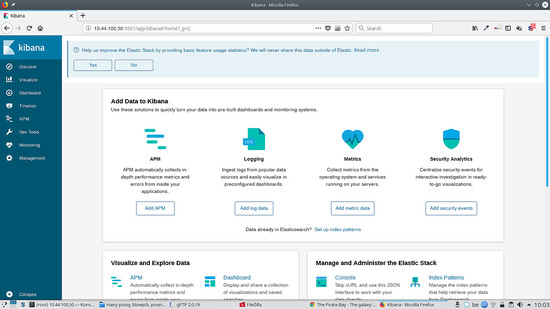
If you go to http://kibana.ip:5601 you will see something like this:
To run Kibana behind apache2 proxy add this to your virtualhost:
ProxyPass /kibana/ http://localhost:5601/
ProxyPassReverse /(.*) http://localhost:5601/(.*)
nano /etc/kibana/kibana.yml
And set the following:
server.basePath: "/kibana"
And of course restart kibana for the changes to take effect:
service kibana stop
service kibana start
Enable mod-proxy and mod-proxy-http in apache2
a2enmod proxy
a2enmod proxy_http
service apache2 restart
Evebox Installation
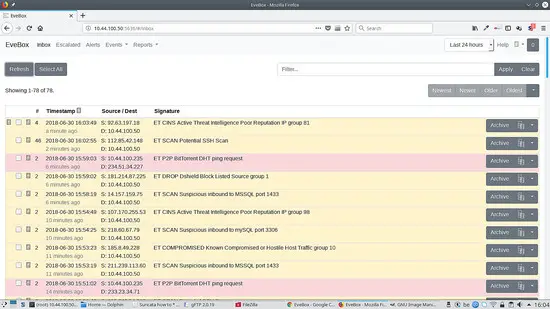
Evebox is a web frontend that displays the Suricata alerts after being processed by ELK.
First we will add the Evebox repository:
wget -qO - https://evebox.org/files/GPG-KEY-evebox | sudo apt-key add -
echo "deb http://files.evebox.org/evebox/debian stable main" | tee /etc/apt/sources.list.d/evebox.list
apt-get update
apt-get install evebox
cp /etc/evebox/evebox.yaml.example /etc/evebox.yaml
And to start evebox at boot:
systemctl enable evebox
We can now start evebox:
service evebox start
Now we can go to http://localhost:5636 and we see the following:
To run Evebox behind apache2 proxy add this to your virtualhost:
ProxyPass /evebox/ http://localhost:5601/
ProxyPassReverse /(.*) http://localhost:5601/(.*)
nano /etc/evebox/evebox.yml
And set the following:
reverse-proxy: true
And of course reload evebox for the changes to take effect:
service evebox force-reload
Enable mod-proxy and mod-proxy-http in apache2
a2enmod proxy
a2enmod proxy_http
service apache2 restart
Filebeat Installation
Filebeat allows you to send logfile entries to a remove logstash service. This is handy when you have multiple instances of Suricata on your network.
Let's install filebeat:
apt install filebeat
Than we need to edit the filebeat configuration and tell it what we want filebeat to monitor.
nano /etc/filebeat/filebeat.yml
And change the following to enable our suricata log to be transmitted:
- type: log

  # Change to true to enable this input configuration.
  enabled: true

  # Paths that should be crawled and fetched. Glob based paths.
  paths:
    - /var/log/suricata/eve.json
    #- c:\programdata\elasticsearch\logs\*
And set the following to send the output to logstash and comment out the eleasticsearch output.
#-------------------------- Elasticsearch output ------------------------------
# output.elasticsearch:
  # Array of hosts to connect to.
# hosts: ["localhost:9200"]

  # Optional protocol and basic auth credentials.
  #protocol: "https"
  #username: "elastic"
  #password: "changeme"

#----------------------------- Logstash output --------------------------------
output.logstash:
  # The Logstash hosts
  hosts: ["ip of the server running logstash:5044"]
Now we need to tell logstash there is a filebeat input coming in so the filebeat will start a listening service on port 5044:
Do the following on the remote server:
nano /etc/logstash/conf.d/10-input.conf
And add the following to the file:
input {
  beats {
    port => 5044
    codec => json
    type => "SuricataIDPS"
  }
}
Now you can start filebeat on the source machine:
service filebeat start
And restart logstash on the remote server:
service logstash stop
service logstash start
Scirius Installation
Scirius is a web frontend for suricata rules management. The open source version only allows you to manage a local suricata install.
Let's install scirius for Suricata rules management
cd /opt
git clone https://github.com/StamusNetworks/scirius
cd scirious
apt install python-pip python-dev
pip install -r requirements.txt
pip install pyinotify
pip install gitpython
pip install gitdb
apt install npm webpack
npm install
Now we need to initiate the Django database
python manage.py migrate
Authentication is by default in scirius so we will need to create a superuser account:
python manage.py createsuperuser
Now we need to initialize scirius:
webpack
Before we start scirius you need to give the hostname or ip address of the machine running scirius to avoid a Django error stating host not allowed and stopping the service, and disable debugging.
nano scirius/settings.py
 SECURITY WARNING: don't run with debug turned on in production!
DEBUG = True

ALLOWED_HOSTS = ['the hostname or ip of the server running scirius']
You can add both the ip address and hostname of the machine by uting the following format: ['ip','hostname'].
python manage.py runserver
You can than connect to localhost:8000.
If you need the application to listen to a reachable address, you can run scirius like this:
python manage.py runserver 192.168.1.1:8000
To run scirius behind apache2 you will need to create a virtualhost configuration like this:
<VirtualHost *:80>
 ServerName scirius.example.tld
 ServerAdmin [email protected]
 ErrorLog ${APACHE_LOG_DIR}/scirius.error.log
 CustomLog ${APACHE_LOG_DIR}/scirius.access.log combined

ProxyPass / http://localhost:8000/

ProxyPassReverse /(.*) http://localhost:8000/(.*)

</VirtualHost>
And enable mod-proxy and mod-proxy-http
a2enmod proxy
a2enmod proxy_http
service apache2 restart
And than you can go to scirius.example.tld and access scirius from there.
To start scirius automatically at boot we need to do the following:
nano /lib/systemd/system/scirius.service
And paste the following in to it:
[Unit]
Description=Scirius Service

After=multi-user.target

[Service]
Type=idle
ExecStart=/usr/bin/python /opt/scirius/manage.py runserver > /var/log/scirius.log 2>&1

[Install] WantedBy=multi-user.target
And execute the following commands to install the new service:
chmod 644 /lib/systemd/system/myscript.servi
systemctl daemon-reload
systemctl enable myscript.service
This concludes this how to.
If you have any remarks or questions post them in the following thread on the forum:
I am subscribed to this thread so I will be notified of any new posts.


