This tutorial exists for these OS versions
- Ubuntu 22.04 (Jammy Jellyfish)
- Ubuntu 20.04 (Focal Fossa)
- Ubuntu 18.04 (Bionic Beaver)
- Ubuntu 16.04 (Xenial Xerus)
- Ubuntu 15.04 (Vivid Vervet)
- Ubuntu 14.04 LTS (Trusty Tahr)
On this page
Server monitoring with Nagios on Ubuntu 14.04 Trusty Tahr and Debian Wheezy
Version 1.0
Author: Srijan Kishore <s [dot] kishore [at] ispconfig [dot] org>
Follow howtoforge on Twitter
Last edited 20/Oct/2014
This document describes how to install and configure Nagios in Ubuntu 14.04 Server. Nagios is a powerful monitoring system that enables organizations to identify and resolve IT infrastructure problems before they affect critical business processes.
Designed with scalability and flexibility in mind, Nagios gives you the peace of mind that comes from knowing your organization's business processes won't be affected by unknown outages.
Nagios is a powerful tool that provides you with instant awareness of your organization's mission-critical IT infrastructure. Nagios allows you to detect and repair problems and mitigate future issues before they affect end-users and customers. This tutorial is also tested over Debian Wheezy server and everything is working fine.
1 Preliminary Note
This tutorial is based on Ubuntu 14.04 server, so you should set up a basic Ubuntu 14.04 server installation before you continue with this tutorial. The system should have a static IP address. I use 192.168.0.100 as my IP address in this tutorial and server1.example.com as the hostname. Additionally you must have a LAMP server configured before following the steps ahead. I will use Nagios to monitor other Ubuntu 14.04 server, so I have another server as 192.168.0.101 as the IP address and server2.example.com as the hostname.
Note: You can also use Debian wheezy as the base for Nagios monitoring server.
2 Installation and configuration of Nagios
We will install the Nagios in Ubuntu 14.04 server server1.example.com I will install it as follows:
apt-get install nagios3 nagios-nrpe-plugin
General type of mail configuration:  <--Internet Site
System mail name:  <--server1.example.com
Nagios web administration password: <--nagiospassword
Nagios web administration password: <--nagiospassword
I gave the password as per my choice, please give the values as per your server environment.
Next we need to configure the Nagios at Server, as follows:
usermod -a -G nagios www-data
chmod -R +x /var/lib/nagios3/
Next change the values for check_external_commands to 1 to enable settings as follows:
nano /etc/nagios3/nagios.cfg
[...]
check_external_commands=1

[...]
Now we need to make the changes effective by restarting the Nagios service by using the command:
service nagios3 restart
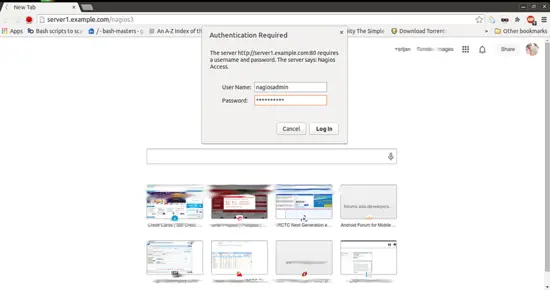
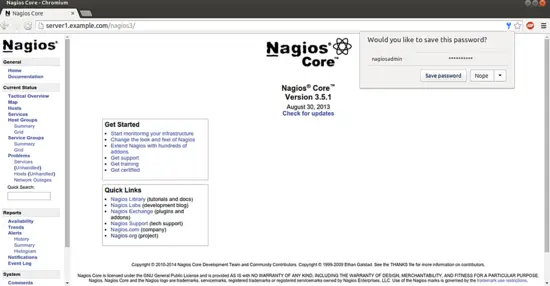
Accessing the web-interface at http://server1.example.com/nagios3 or http://192.168.0.100/nagios3 as follows:
Username will be nagiosadmin and password as created above nagiospassword
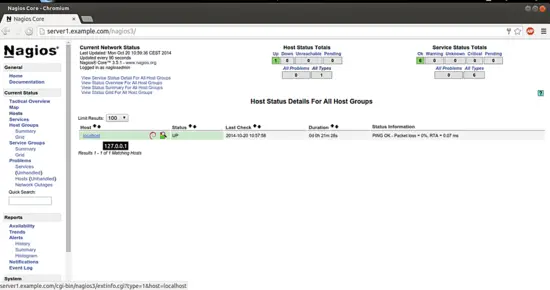
Next click on Host Groups:
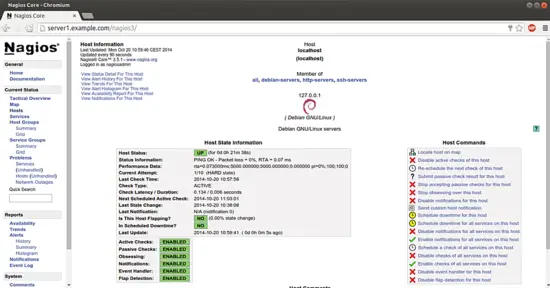
It will show the present Ubuntu server as localhost. Just click over the localhost.
4 Adding clients in Nagios
Now we need to add client(nodes) to get the monitoring service for the clients. I will add one more node as Ubuntu Server at server2.example.com. We need to install these packages as follows:
apt-get install nagios-nrpe-server nagios-plugins
Further at server2.example.com define the main Nagios monitoring server entries in Nagios configuration file as :
nano /etc/nagios/nrpe.cfg
[...]
allowed_hosts=127.0.0.1 192.168.0.100
[...]
Where 192.168.0.100 is the main Nagios monitor server server1.example.com IP. Next start nrpe service as shown below
service nagios-nrpe-server start
Similarly we can add more nodes to which we want monitoring.
We also need to define the Nagios client entries at server end. Create a file monitor1.cfg in directory /etc/nagios3/conf.d/ and define the values at server1.example.com. In the object configuration files, you can define hosts, host groups, contacts, contact groups, services, etc. You can split your object definitions across several config files if you wish, or keep them all in a single config file.
nano /etc/nagios3/conf.d/monitor1.cfg
Default directory is /etc/nagios3/conf.d/ , you can use any name such as I used monitor1.cfg Entries must be like this:
define host {
        use                     generic-host
        host_name               server2.example.com
        alias                   srijan
        address                 192.168.0.101
        }

define service {
        use                             generic-service
        host_name                       server2.example.com
        service_description             PING
        check_command                   check_ping!100.0,20%!500.0,60%
        }

define service {
        use                             generic-service
        host_name                       server2.example.com
        service_description             SSH
        check_command                   check_ssh
        notifications_enabled           0
        }

define service {
        use                             generic-service
        host_name                       server2.example.com
        service_description             DISK
        check_command                   check_disk
        notifications_enabled           0
        }
In above file define host contains the information about the added client server2.example.com, next we can use Nagios to check different services. I used to check PING SSH and DISK services. For more details of services used in Nagios check directory /etc/nagios-plugins/config.
Next to make the changes effective restart the nagios3 service.
service nagios3 restart
Now we can check the client details at the Nagios web-interface at Host Groups as follows:
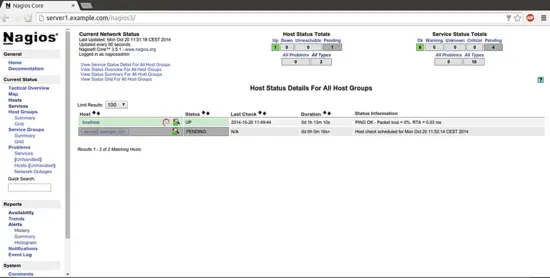
Next on server2.example.com and check the values there.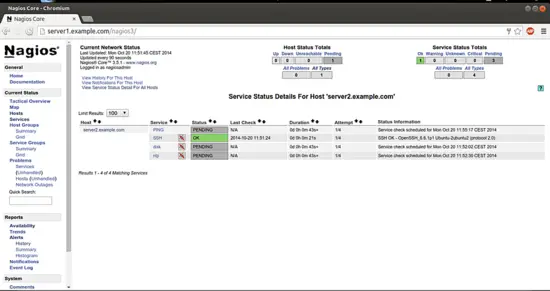
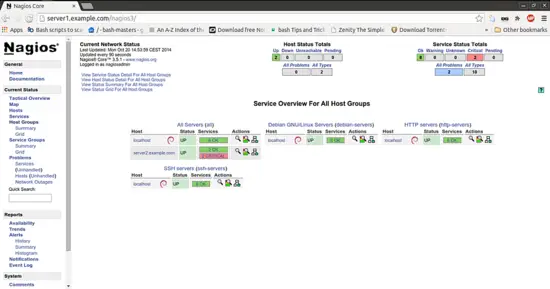
In the same way we can add more clients(nodes) and monitor them as per our needs. Congratulations! Now we have successfully configured Nagios monitoring tool in Ubuntu 14.04 :)
5 Links
- Ubuntu : http://www.ubuntu.com/
- Debian : http://www.debian.org/
- Nagios : http://www.nagios.org/

