How to Install Nagios Server Monitoring on Ubuntu 16.04
This tutorial exists for these OS versions
- Ubuntu 22.04 (Jammy Jellyfish)
- Ubuntu 20.04 (Focal Fossa)
- Ubuntu 18.04 (Bionic Beaver)
- Ubuntu 16.04 (Xenial Xerus)
- Ubuntu 15.04 (Vivid Vervet)
- Ubuntu 14.04 LTS (Trusty Tahr)
On this page
Nagios is an open source software for system and network monitoring. Nagios can monitor the activity of a host and its services, and provides a warning/alert if something bad happens on the server. Nagios can run on Linux operating systems. At this time, I'm using Ubuntu 16.04 for the installation.
Prerequisites
- 2 Ubuntu 16.04 - 64bit servers
- 1 - Nagios Host with IP: 192.168.1.9
- 2 - Ubuntu Client with IP: 192.168.1.10
- Root/Sudo access
What we will do in this tutorial:
- Software the package dependencies like - LAMP etc.
- User and group configuration.
- Installing Nagios.
- Configuring Apache.
- Testing the Nagios Server.
- Adding a Host to Monitor.
Installing the prerequisites
Nagios requires the gcc compiler and build-essentials for the compilation, LAMP (Apache, PHP, MySQL) for the Nagios web interface and Sendmail to send alerts from the server. To install all those packages, run this command (it's just 1 line):
sudo apt-get install wget build-essential apache2 php apache2-mod-php7.0 php-gd libgd-dev sendmail unzip
User and group configuration
For Nagios to run, you have to create a new user for Nagios. We will name the user "nagios" and additionally create a group named "nagcmd". We add the new user to the group as shown below:
useradd nagios
groupadd nagcmd
usermod -a -G nagcmd nagios
usermod -a -G nagios,nagcmd www-data
Installing Nagios
Step 1 - Download and extract the Nagios core
cd ~
wget https://assets.nagios.com/downloads/nagioscore/releases/nagios-4.2.0.tar.gz
tar -xzf nagios*.tar.gz
cd nagios-4.2.0
Step 2 - Compile Nagios
Before you build Nagios, you will have to configure it with the user and the group you have created earlier.
./configure --with-nagios-group=nagios --with-command-group=nagcmd
For more information please use: ./configure --help .
Now to install Nagios:
make all
sudo make install
sudo make install-commandmode
sudo make install-init
sudo make install-config
/usr/bin/install -c -m 644 sample-config/httpd.conf /etc/apache2/sites-available/nagios.conf
And copy evenhandler directory to the nagios directory:
cp -R contrib/eventhandlers/ /usr/local/nagios/libexec/
chown -R nagios:nagios /usr/local/nagios/libexec/eventhandlers
Step 3 - Install the Nagios Plugins
Download and extract the Nagios plugins:
cd ~
wget https://nagios-plugins.org/download/nagios-plugins-2.1.2.tar.gz
tar -xzf nagios-plugins*.tar.gz
cd nagios-plugin-2.1.2/
Install the Nagios plugin's with the commands below:
./configure --with-nagios-user=nagios --with-nagios-group=nagios --with-openssl
make
make install
Step 4 - Configure Nagios
After the installation phase is complete, you can find the default configuration of Nagios in /usr/local/nagios/.
We will configure Nagios and Nagios contact.
Edit default nagios configuration with vim:
vim /usr/local/nagios/etc/nagios.cfg
uncomment line 51 for the host monitor configuration.
cfg_dir=/usr/local/nagios/etc/servers
Save and exit.
Add a new folder named servers:
mkdir -p /usr/local/nagios/etc/servers
The Nagios contact can be configured in the contact.cfg file. To open it use:
vim /usr/local/nagios/etc/objects/contacts.cfg
Then replace the default email with your own email.
Configuring Apache
Step 1 - enable Apache modules
sudo a2enmod rewrite
sudo a2enmod cgi
You can use the htpasswd command to configure a user nagiosadmin for the nagios web interface
sudo htpasswd -c /usr/local/nagios/etc/htpasswd.users nagiosadmin
and type your password.
Step 2 - enable the Nagios virtualhost
sudo ln -s /etc/apache2/sites-available/nagios.conf /etc/apache2/sites-enabled/
Step 3 - Start Apache and Nagios
service apache2 restart
service nagios start
When Nagios starts, you may see the following error :
Starting nagios (via systemctl): nagios.serviceFailed
And this is how to fix it:
cd /etc/init.d/
cp /etc/init.d/skeleton /etc/init.d/nagios
Now edit the Nagios file:
vim /etc/init.d/nagios
... and add the following code:
DESC="Nagios"
NAME=nagios
DAEMON=/usr/local/nagios/bin/$NAME
DAEMON_ARGS="-d /usr/local/nagios/etc/nagios.cfg"
PIDFILE=/usr/local/nagios/var/$NAME.lock
Make it executable and start Nagios:
chmod +x /etc/init.d/nagios
service apache2 restart
servuce nagios start
Testing the Nagios Server
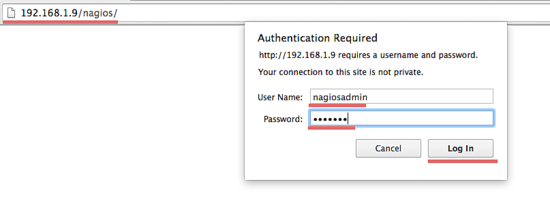
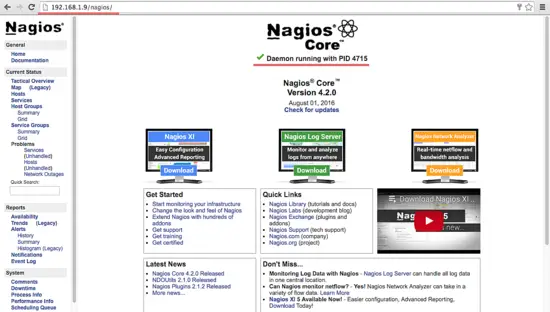
Please open your browser and access the Nagios server ip, in my case: http://192.168.1.9/nagios.
Nagios Login with apache htpasswd.
Nagios Admin Dashboard
Adding a Host to Monitor
In this tutorial, I will add an Ubuntu host to monitor to the Nagios server we have made above.
Nagios Server IP : 192.168.1.9
Ubuntu Host IP : 192.168.1.10
Step 1 - Connect to ubuntu host
ssh [email protected]
Step 2 - Install NRPE Service
sudo apt-get install nagios-nrpe-server nagios-plugins
Step 3 - Configure NRPE
After the installation is complete, edit the nrpe file /etc/nagios/nrpe.cfg:
vim /etc/nagios/nrpe.cfg
... and add Nagios Server IP 192.168.1.9 to the server_address.
server_address=192.168.1.9
Step 4 - Restart NRPE
service nagios-nrpe-server restart
Step 5 - Add Ubuntu Host to Nagios Server
Please connect to the Nagios server:
ssh [email protected]
Then create a new file for the host configuration in /usr/local/nagios/etc/servers/.
vim /usr/local/nagios/etc/servers/ubuntu_host.cfg
Add the following lines:
# Ubuntu Host configuration file

define host {
        use                          linux-server
        host_name                    ubuntu_host
        alias                        Ubuntu Host
        address                      192.168.1.10
        register                     1
}

define service {
      host_name                       ubuntu_host
      service_description             PING
      check_command                   check_ping!100.0,20%!500.0,60%
      max_check_attempts              2
      check_interval                  2
      retry_interval                  2
      check_period                    24x7
      check_freshness                 1
      contact_groups                  admins
      notification_interval           2
      notification_period             24x7
      notifications_enabled           1
      register                        1
}

define service {
      host_name                       ubuntu_host
      service_description             Check Users
      check_command           check_local_users!20!50
      max_check_attempts              2
      check_interval                  2
      retry_interval                  2
      check_period                    24x7
      check_freshness                 1
      contact_groups                  admins
      notification_interval           2
      notification_period             24x7
      notifications_enabled           1
      register                        1
}

define service {
      host_name                       ubuntu_host
      service_description             Local Disk
      check_command                   check_local_disk!20%!10%!/
      max_check_attempts              2
      check_interval                  2
      retry_interval                  2
      check_period                    24x7
      check_freshness                 1
      contact_groups                  admins
      notification_interval           2
      notification_period             24x7
      notifications_enabled           1
      register                        1
}

define service {
      host_name                       ubuntu_host
      service_description             Check SSH
      check_command                   check_ssh
      max_check_attempts              2
      check_interval                  2
      retry_interval                  2
      check_period                    24x7
      check_freshness                 1
      contact_groups                  admins
      notification_interval           2
      notification_period             24x7
      notifications_enabled           1
      register                        1
}

define service {
      host_name                       ubuntu_host
      service_description             Total Process
      check_command                   check_local_procs!250!400!RSZDT
      max_check_attempts              2
      check_interval                  2
      retry_interval                  2
      check_period                    24x7
      check_freshness                 1
      contact_groups                  admins
      notification_interval           2
      notification_period             24x7
      notifications_enabled           1
      register                        1
}
You can find many check_command in /usr/local/nagios/etc/objects/commands.cfg file. See there if you want to add more services like DHCP, POP etc.
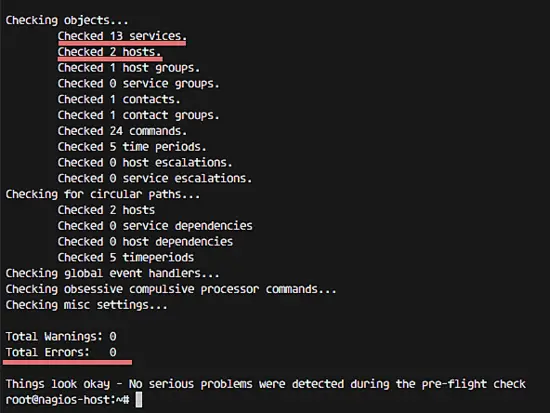
And now check the configuration:
/usr/local/nagios/bin/nagios -v /usr/local/nagios/etc/nagios.cfg
... to see if the configuration is correct.
Step 6 - Restart all services
On the Ubuntu Host start NRPE Service:
service nagios-nrpe-server restart
... and on the Nagios server, start Apache and Nagios:
service apache2 restart
service nagios restart
Step 7 - Testing the Ubuntu Host
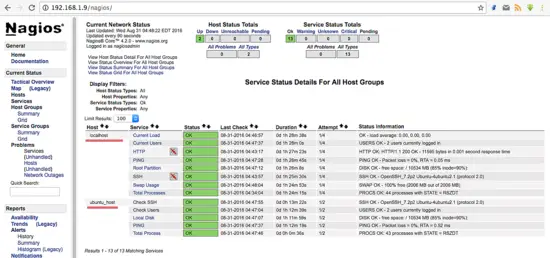
Open the Nagios server from the browser and see the ubuntu_host being monitored.
The Ubuntu host is available on monitored host.
All services monitored without error.
Conclusion
Nagios is an open source application for monitoring a system. Nagios has been widely used because of the ease of configuration. Nagios in support by various plugins, and you can even create your own plugins. Look here for more information.


