How to Install Zeek Network Security Monitoring Tool on Ubuntu 24.04
This tutorial exists for these OS versions
- Ubuntu 24.04 (Noble Numbat)
- Ubuntu 22.04 (Jammy Jellyfish)
On this page
Zeek (formerly Bro) is a free and open-source platform for network security monitoring. It is a powerful passive network traffic analyzer that investigates suspicious or malicious activity. Zeek can be used as a network security monitor (NSM) and supports a wide range of traffic analysis, from the security domain to performance measurement and troubleshooting.
In this tutorial, you'll learn how to install the Zeek network security monitoring tool on the Ubuntu 24.04 server. You'll also learn how to run Zeek in a cluster mode, how to parse Zeek log with the 'zeek-cut' command, and how to generate and parse Zeek JSON log with the 'jq' utility.
Prerequisites
Before you begin, make sure you have the following:
- An Ubuntu 24.04 server
- A non-root user with administrator privileges
Installing Zeek
Zeek is a network security monitoring tool Unix-like operating system. It can be installed using multiple methods. In this example, you'll install Zeek to the Ubuntu 24.04 server with the APT package manager from the OpenSUSE build service.
First, run the command below to add the Zeek repository to your Ubuntu system.
echo 'deb http://download.opensuse.org/repositories/security:/zeek/xUbuntu_24.04/ /' | sudo tee /etc/apt/sources.list.d/security:zeek.list
Now download and add the GPG key for the Zeek repository with the command below.
curl -fsSL https://download.opensuse.org/repositories/security:zeek/xUbuntu_24.04/Release.key | \
gpg --dearmor | sudo tee /etc/apt/trusted.gpg.d/security_zeek.gpg > /dev/null
Once the Zeek GPG key and repository are added, run the 'apt' command below to update your Ubuntu package.
sudo apt update

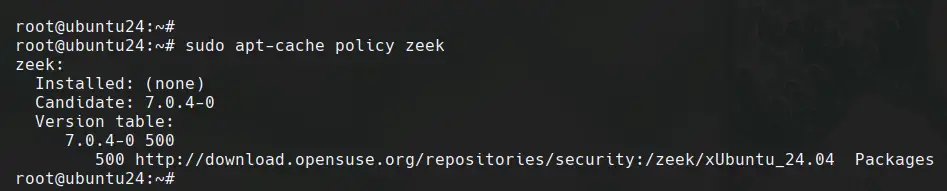
You can now run the 'apt' command below to check the 'zeek' package. You'll see multiple version Zeek versions.
sudo apt search zeek
sudo apt-cache policy zeek
Next, install Zeek with the following 'apt' command. In this example, you'll install Zeek LTS.
sudo apt install zeek
Enter 'Y' to confirm the installation.

After the installation is finished, add the '/opt/zeek/bin' directory to the system PATH through the '~/.bashrc' file. And then reload the '~/.bashrc' file to apply your new changes. With this, you can run the Zeek command line through your terminal.
echo "export PATH=$PATH:/opt/zeek/bin" >> ~/.bashrc
source ~/.bashrc
Lastly, run the 'zeek' command below to check the Zeek version and basic commands and options.
zeek --version
zeek --help
You'll see an output like the following:

Setting up Zeek
After Zeek is installed, you need to set up how Zeek will be running on your infrastructure. You can choose to run Zeek in a standalone or cluster mode. For large, deployments, you can use cluster mode, where Zeek components are installed on separate servers. For this testing purpose, we'll set and run Zeek in a Cluster mode using a single server.
Check your server IP address with the following 'ip' command. In this example, we have an Ubuntu server IP address '192.168.10.60'.
ip a
Open Zeek network configuration '/opt/zeek/etc/networks.cfg' with the 'nano' editor.
sudo nano /opt/zeek/etc/networks.cfg
Input your network subnet of target servers like the following.
192.168.10.0/24 Local Network
Save the file and exit the editor when finished.
Now open the Zeek node configuration '/opt/zeek/etc/node.cfg' using 'nano'.
sudo nano /opt/zeek/etc/node.cfg
Comment the following lines to disable Zeek standalone mode. By default, Zeek is running in standalone mode with the default 'localhost' and network interface 'eth0'.
#[zeek]
#type=standalone
#host=localhost
#interface=eth0
Paste the following configuration to run Zeek in the cluster mode within a single server. Make sure to change the IP address with your Ubuntu server IP address. As you can see below, Zeek cluster mode will have multiple components such as logger, manager, proxy, and workers.
# logger
[zeek-logger]
type=logger
host=192.168.10.60

# manager
[zeek-manager]
type=manager
host=192.168.10.60

# proxy
[zeek-proxy]
type=proxy
host=192.168.10.60

# worker
[zeek-worker]
type=worker
host=192.168.10.60
interface=eth0

# worker localhost
[zeek-worker-lo]
type=worker
host=localhost
interface=lo
When finished, save the file and exit the editor.
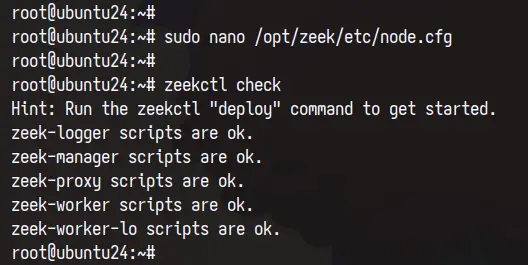
Next, run the 'zeekctl' command below to verify your Zeek syntax. If you've proper configuration, you'll see an output 'scripts are ok'.
zeekctl check
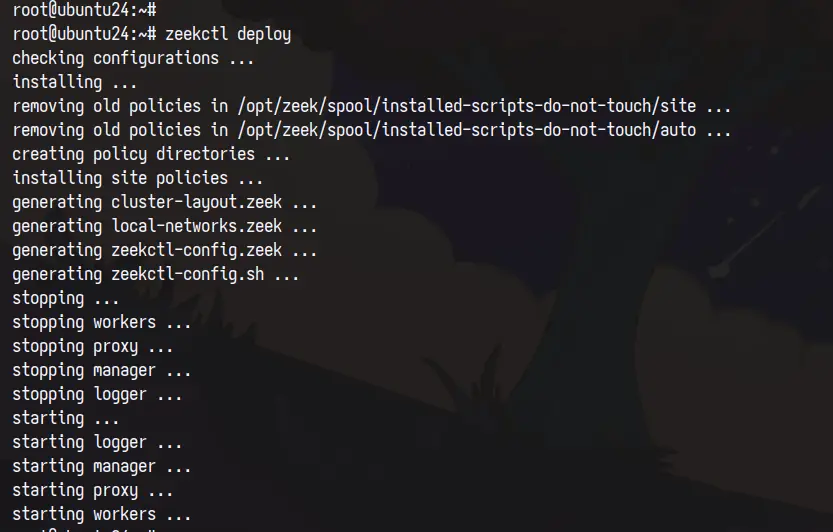
Now run the 'deploy' command to deploy your Zeek installation. With this, the Zeek logger, manager, proxy, and workers will be started.
zeekctl deploy

You can check each Zeek component with the command below.
zeekctl status
In the output below, you can see that each Zeek component is running. This means that the deployment of the Zeek cluster single node is successful.

Using zeek-cut to parse Zeek Logs
Now that you've installed and deployed Zeek, log files of your network will be generated at the '/opt/zeek/logs/current' directory. There will be multiple Zeek log files that you must know and keep your eye on. In this section, you'll learn how to use the 'zeek-cut' utility to generate logs in TSV (Tab Separated Value) format.
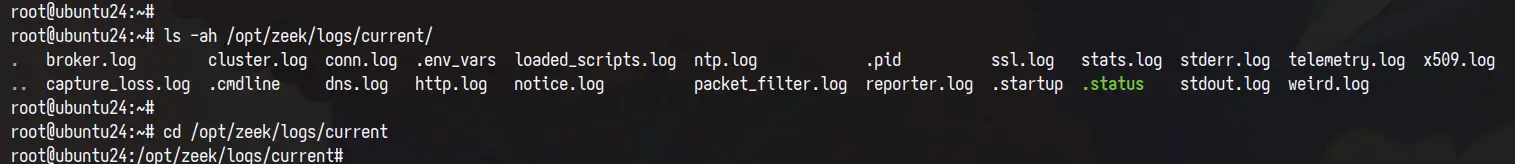
Check the Zeek logs directory '/opt/zeek/logs/current' with the 'ls' command below.
ls -ah /opt/zeek/logs/current/
You'll see multiple log files such as :
- conn.log: The connection log for both TCP and UDP. This log file provides the most useful information such as timestamp, connection duration, service, and many more
- dns.log: The DNS (Domain Name System) log file
- http.log.log: The HyperText Transfer Protocol (HTTP) log
- ssh.log: The Secure Shell (SSH) log for tracking SSH connections.
- ssl.log: The Secure Socket Layer (SSL) log that also contains the HTTPS log
Now move to the '/opt/zeek/logs/current' directory and can run the 'cat' command to show Zeek logs and pipe the output with the 'zeek-cut' command to parse the output to the TSV (Tab Separated Value) format.
cd /opt/zeek/logs/current/
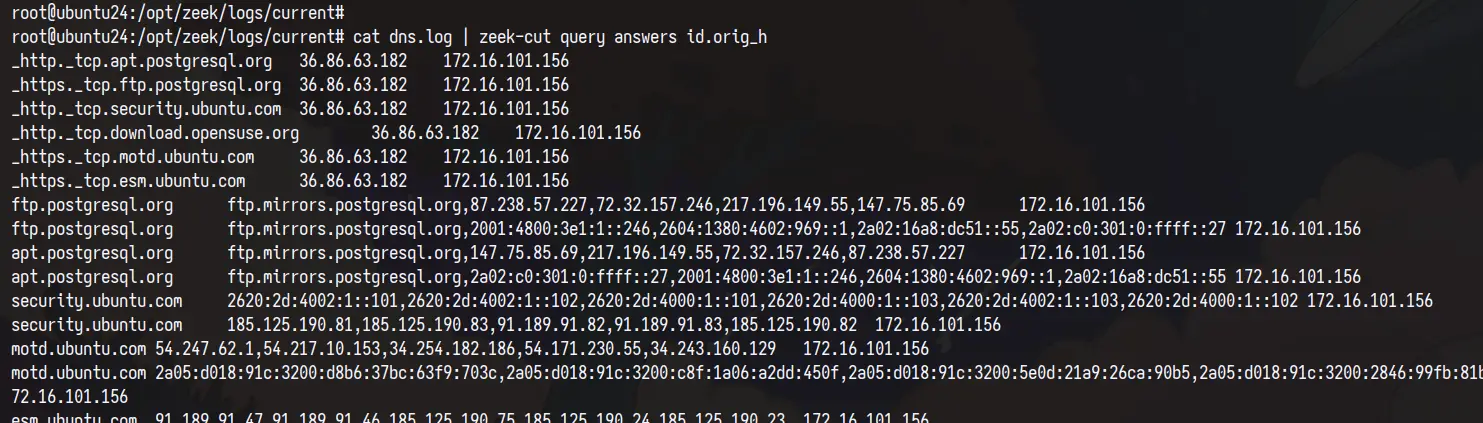
cat dns.log | zeek-cut id.orig_h query answers
cat dns.log | zeek-cut query answers id.orig_h
In this example, we'll show you values from fields 'id.orig_h', 'query', and 'answers'.

You can also use the 'zeek-cut' command like the following to process the TSV logs and get similar output.
zeek-cut id.orig_h query answers < dns.log
Setting up Zeek output to JSON
Zeek supports multiple log formats, including TSV and JSON. In this section, you'll learn how to generate a Zeek log in JSON format. Then, you'll learn how to parse JSON logs with the 'jq' command line so you can easily read your logs.
Open Zeek configuration '/opt/zeek/share/zeek/site/local.zeek' with the following 'nano' editor.
sudo nano /opt/zeek/share/zeek/site/local.zeek
Uncomment the following line to enable the output log to JSON.
@load policy/tuning/json-logs
Save the file and exit the editor.
Now run the 'zeekctl' command below to apply and deploy your changes. And once the process is finished, the JSON log format will be generated by Zeek.
zeekctl deploy
You can see the following output during Zeek deployment.
Next, run the 'cat' command below to check the Zeek log file. You'll see the that Zeek log is now in JSON format.
cat /opt/zeek/logs/current/dns.log
Parsing Zeek JSON format with jq
Install the 'jq' package with the 'apt' command below.
sudo apt install jq -y
Once the installation is finished, go to the '/opt/zeek/logs/current' directory with the 'cd' command.
cd /opt/zeek/logs/current/
To parse logs in JSON format, run the 'jq' command below.
jq . dns.log

If you want to have compact output, use the '-c' option like the following:
jq . -c dns.log
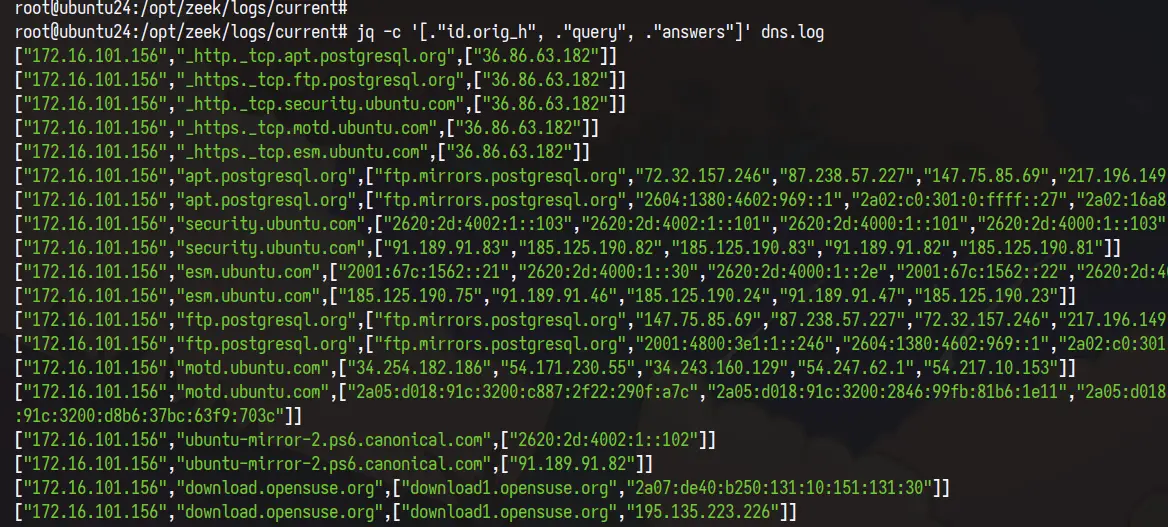
Lastly, you can also specify files of JSON log files with the 'jq' command below.
jq -c '[."id.orig_h", ."query", ."answers"]' dns.log
Conclusion
Congratulations! You've completed the installation of the Zeek Network Monitoring Tool on the Ubuntu 24.04 server. You've learned how to deploy Zeek cluster mode in a single node/server, parsing Zeek log with 'zeek-cut' utility to generate TSV (Tab Separated Value) format, generating Zeek log in JSON format, and parse JSON log with 'jq' utility. From here, you can proceed to the next step by sending your JSON log or Zeek logs to a centralized logging system such as Graylog and ELK/EFK Stack.

