How to Install Prometheus System Monitoring Tool on Ubuntu 20.04
This tutorial exists for these OS versions
- Ubuntu 22.04 (Jammy Jellyfish)
- Ubuntu 20.04 (Focal Fossa)
- Ubuntu 18.04 (Bionic Beaver)
On this page
In this tutorial, we will learn how to install Prometheus on Ubuntu 20.04. For those unfamiliar with Prometheus, it is a system monitoring tool that provides an overview of all your system's metrics and performance information so you can identify any problems or bottlenecks. You might find it useful if you want to keep track of resources such as CPU usage, memory utilization, network IO wait time, etc... It has a web interface that allows for easy monitoring from any device with an internet connection and also supports alerting via email and SMS messages in case the metrics surpass a configured threshold.
Prerequisites
- A server running Ubuntu 20.04 LTS with at least 2GB of RAM and 1 vCPU.
- Log in as root or a non-root user with sudo privileges.
Install Nginx
You should always update your repository by running this command:
sudo apt update
This will prompt you, the default response is y and Enter. We do not advise to press n when prompted for it may cause issues with packages or programs being installed later on.
The repositories are updated by your system now through an intermediate process and on completion of this step, you can proceed to installing nginx using the command below:
sudo apt install nginx
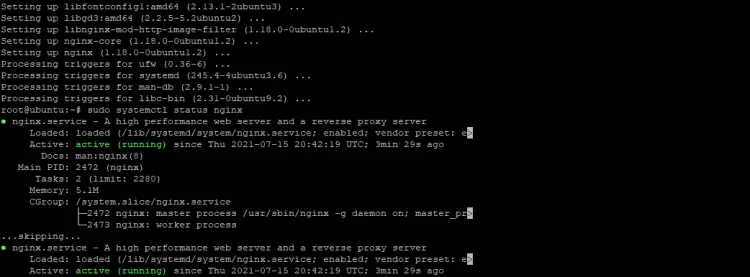
The Nginx service is now running and will respond to requests. You can check by running command below:
sudo systemctl status nginx
If you see output similar to the following, then Nginx is running:
If your Nginx service isn't running, you can start it by entering the following command:
sudo systemctl start nginx
That's it! nginx has been running on your server
Create Prometheus System User
The Prometheus server requires a service user account to run. You can create the user with the following command. Substitute your own application name for prometheus-server in place of "node_exporter".
sudo useradd --no-create-home --shell /bin/false prome
sudo useradd --no-create-home --shell /bin/false node_exporter
Create Prometheus Directories
Next, you need to make some directories. These are where the configuration files and other data will be stored. These directories will be created in the directory you previously selected for Prometheus. In this example, we will use /ect/prometheus and /var/lib/prometheus as the base directory:
sudo mkdir /etc/prometheus
sudo mkdir /var/lib/prometheus
Downloading and Installing Prometheus
We can download Prometheus for Linux by simply using wget. We navigate to the most recent version of downloads on their website and grab it from there.
wget https://github.com/prometheus/prometheus/releases/download/v2.28.1/prometheus-2.28.1.linux-amd64.tar.gz
Once you have downloaded the binary, extract it using the tar command:
tar -xvf prometheus-2.28.1.linux-amd64.tar.gz
From the extracted folder, copy the prometheus and promtool binaries to /usr/local/bin directory:
sudo cp prometheus-2.28.1.linux-amd64/prometheus /usr/local/bin/
sudo cp prometheus-2.28.1.linux-amd64/promtool /usr/local/bin/
After copying, change the ownership of the files to prometheus by entering the commands below:
sudo chown prome:prome /usr/local/bin/prometheus
sudo chown prome:prome /usr/local/bin/promtool
Next, copy the following directories to your Prometheus configuration directory /etc/prometheus: "console_libraries" and "prometheus". It's important not to forget this step!
sudo cp -r prometheus-2.28.1.linux-amd64/consoles /etc/prometheus
sudo cp -r prometheus-2.28.1.linux-amd64/console_libraries /etc/prometheus
Use the following commands to change file ownership:
sudo chown -R prome:prome /etc/prometheus/consoles
sudo chown -R prome:prome /etc/prometheus/console_libraries
Create Prometheus Configuration file
Prometheus needs a configuration file to work. The prometheous.yml is the most common way of configuring it in use. In this section, we will create the configurations files named prometheus.yml in /etc/prometheus directory created earlier.
sudo nano /etc/prometheus/prometheus.yml
Next, copy and paste the following lines into your terminal:
global:
 scrape_interval: 15s
scrape_configs:
 - job_name: 'prometheus'
 scrape_interval: 5s
 static_configs:
 - targets: ['localhost:9090']
When you are done hit Ctrl+x then y then enter to save the file.
The default configuration has a single job called Prometheus which scrapes the time series data exposed by the server. The job contains only one target, localhost on port 9090 and is statically configured.
We now need to create a file for the systemd service. Run the command below:
sudo nano /etc/systemd/system/prometheus.service
Copy and paste the following content into the file:
[Unit]
Description=Prometheus
Wants=network-online.target
After=network-online.target
[Service]
User=prome
Group=prome
Type=simple
ExecStart=/usr/local/bin/prometheus \
 --config.file /etc/prometheus/prometheus.yml \
 --storage.tsdb.path /var/lib/prometheus/ \
 --web.console.templates=/etc/prometheus/consoles \
 --web.console.libraries=/etc/prometheus/console_libraries
[Install]
The service file tells systemd to run Prometheus as the prometheus user, with a configuration in /etc/prometheus directory and data stored in /var/libdirectory.
When you are done hit Ctrl+x then y then enter to save the file.
To use the newly created service, reload systemd by running the command below:
sudo systemctl daemon-reload
You can now start Prometheus using the following command:
sudo systemctl enable prometheus
You can check on the service status by using the command below:
sudo systemctl status prometheus
prometheus.service - Prometheus
 Loaded: loaded (/etc/systemd/system/prometheus.service; disabled; vendor preset: enabled)
 Active: active (running) since Thu 2021-07-15 22:31:10 UTC; 3s ago
 Process: 3949 ExecStart=/usr/local/bin/prometheus --config.file /etc/prometheus>
 Main PID: 3949 (prometheus)
 Tasks: 7
 Memory: 13.8M
 CPU: 470ms
 CGroup: /system.slice/prometheus.service
The Prometheus status monitor tells you the service's current level of activity. You can also see what process it’s currently running and how much memory it uses at any given time.
Testing Prometheus
Prometheus provides a basic web interface with which users can view statistics about themselves and other programs they have installed in order to determine whether there are any problems going on within them.
To access the Prometheus service, you first need to open up port 9090 on your firewall. You can do this by typing in:
ufw allow 9090/tcp
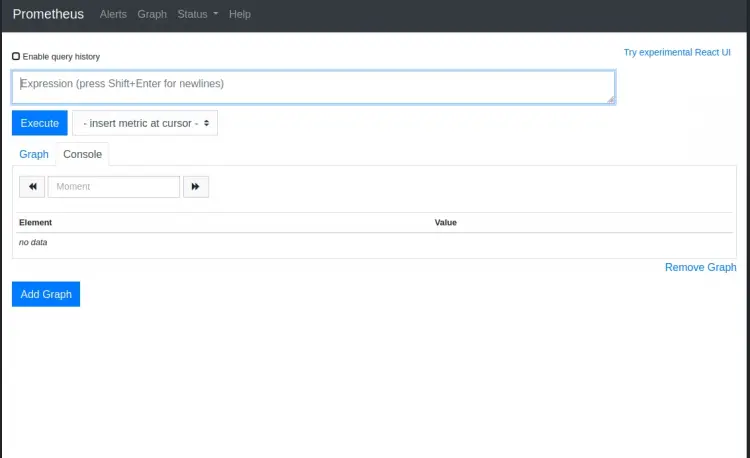
Now open a web browser and navigate to the following address:
http://ip-address:9090
Replace the term “ip-address” with your server's actual IP address. You can also use localhost or 127.0.0.1 to access Prometheus on your system locally and see if it is running properly.
The Prometheus application is now live and ready to receive web requests:
Conclusion
We hope that you found the tutorial helpful and are excited to test out your own installation. This is just one of many tutorials on our website, so if there's anything else you want to know about monitoring or Prometheus, let us know in a comment below!


