How To Install Prometheus on Ubuntu 18.04 LTS
This tutorial exists for these OS versions
- Ubuntu 22.04 (Jammy Jellyfish)
- Ubuntu 20.04 (Focal Fossa)
- Ubuntu 18.04 (Bionic Beaver)
On this page
Prometheus is a free and open source software ecosystem that allows us to collect metrics from our applications and stores them in a database, especially a time-series based DB. It is a very powerful monitoring system suitable for dynamic environments. Prometheus is written in Go and use query language for data processing. Prometheus provides metrics of CPU, memory, disk usage, I/O, network statistics, MySQL server and Nginx.
In this tutorial, we will explain how to install Prometheus on Ubuntu 18.04 server.
Requirements
- A server running Ubuntu 18.04 LTS.
- A non-root user with sudo privileges.
Install Prometheus
By default, Prometheus is not available in the Ubuntu 18.04 LTS (Bionic Beaver) default repository. So you will need to add the repository for that.
First, download and add the GPG key with the following command:
wget https://s3-eu-west-1.amazonaws.com/deb.robustperception.io/41EFC99D.gpg | sudo apt-key add -
Next, update the repository and install Prometheus with the following command:
sudo apt-get update -y
sudo apt-get install prometheus prometheus-node-exporter prometheus-pushgateway prometheus-alertmanager-y
Once the installation is completed, start Prometheus service and enable it to start on boot time with the following command:
sudo systemctl start prometheus
sudo systemctl enable prometheus
You can also check the status of Prometheus service with the following command:
sudo systemctl status prometheus
Output:
? prometheus.service - Monitoring system and time series database
   Loaded: loaded (/lib/systemd/system/prometheus.service; enabled; vendor preset: enabled)
   Active: active (running) since Fri 2018-08-10 17:04:20 UTC; 9s ago
     Docs: https://prometheus.io/docs/introduction/overview/
 Main PID: 16885 (prometheus)
    Tasks: 7 (limit: 1114)
   CGroup: /system.slice/prometheus.service
           ??16885 /usr/bin/prometheus

Aug 10 17:04:20 ubuntu1804 prometheus[16885]: level=info ts=2018-08-10T17:04:20.350218887Z caller=main.go:218 msg="Starting Prometheus" version
Aug 10 17:04:20 ubuntu1804 prometheus[16885]: level=info ts=2018-08-10T17:04:20.351807036Z caller=main.go:219 build_context="(go=go1.9.2, user=
Aug 10 17:04:20 ubuntu1804 prometheus[16885]: level=info ts=2018-08-10T17:04:20.35248264Z caller=main.go:220 host_details="(Linux 4.15.0-20-gen
Aug 10 17:04:20 ubuntu1804 prometheus[16885]: level=info ts=2018-08-10T17:04:20.353074121Z caller=main.go:221 fd_limits="(soft=1024, hard=4096)
Aug 10 17:04:20 ubuntu1804 prometheus[16885]: level=info ts=2018-08-10T17:04:20.392570017Z caller=main.go:492 msg="Starting TSDB ..."
Aug 10 17:04:20 ubuntu1804 prometheus[16885]: level=info ts=2018-08-10T17:04:20.432567016Z caller=web.go:359 component=web msg="Start listening
Aug 10 17:04:20 ubuntu1804 prometheus[16885]: level=info ts=2018-08-10T17:04:20.49325436Z caller=main.go:502 msg="TSDB started"
Aug 10 17:04:20 ubuntu1804 prometheus[16885]: level=info ts=2018-08-10T17:04:20.497888806Z caller=main.go:578 msg="Loading configuration file"
Aug 10 17:04:20 ubuntu1804 prometheus[16885]: level=info ts=2018-08-10T17:04:20.511419604Z caller=main.go:479 msg="Server is ready to receive w
Aug 10 17:04:20 ubuntu1804 prometheus[16885]: level=info ts=2018-08-10T17:04:20.554879161Z caller=manager.go:59 component="scrape manager" msg=
Access Prometheus
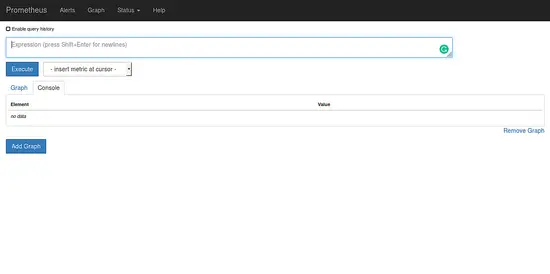
Prometheus is now installed and listening on port 9090. Open your web browser and type the URL http://your-server-ip:9090. You will be redirected to the Prometheus dashboard:
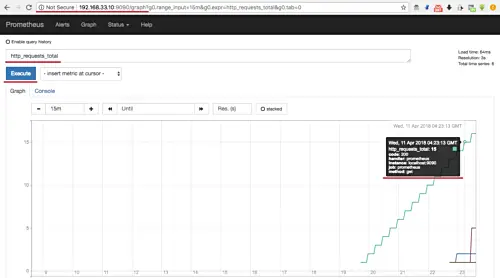
The result of an example data query.


