4 CLI based Linux Performance Monitoring Tools: top, htop, ps and vmstat
On this page
Linux is a very stable operating system with strong security features. On several occasions, we may need to observe the performance of our system, maybe because of some technical glitch or as a part of a routine health checkup. Performance measurement gives us a quick insight into how our system is doing, e.g. performance logs can tell us what processes are running, how much memory is in use, how much CPU is being used etc. This information also helps us in making decisions related to effective resource planning, debugging system issues etc. Most Linux distros provide command-line tools and graphical ones to accomplish this task. Some of these come pre-shipped with the OS and some may need to be installed. These tools are classified as either real-time monitoring tools or log-based tools.
Real-time monitoring tools, as the name suggests, provide information about the system in its current state. The results are continuously updated.
Log-based tools store the performance results in a file which can be later retrieved for processing, analyzing or working with another application.
What will we do here?
In this guide, we will present some of the commonly used command line-based tools for monitoring system performance. We are using Ubuntu 20.04 OS for this guide, although the tools we are going to discuss are available for most Linux-based distros.
Why the CLI way?
One obvious question that may come to mind is why we are more concerned with the command line-based tools. The first reason is that you may not always be lucky to get a graphical environment to work, for e.g. the system you are working on maybe a remote production server and does not have a graphical interface. If for a moment you have a local system, you may not have privileges to install a graphical interface on it. Another reason is that with a command-line interface we have the opportunity for multitasking. Tmux is such an application from where we can monitor multiple systems at the same time.
1. Top
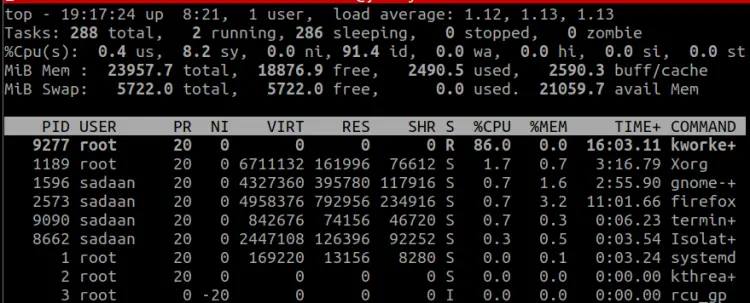
This command displays a real-time system status summary. The output displays the amount of system memory(RAM) used for different purposes, percentage of CPU being utilized, swap memory, and other information. The processes statistics in terms of memory and cpu usage are also displayed by simply running the top command without any option:
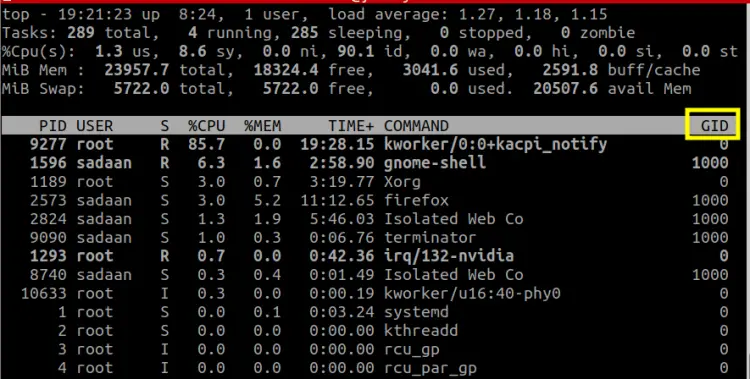
We can also select the columns to display in the ‘top’ output by typing ‘f’ while ‘top’ is running. On the new screen select or unselect any column by pressing the ‘space bar’ or ‘d’ and then press ‘esc’ to return. In the picture below we have removed some columns and added a new one (GID):
2. Htop
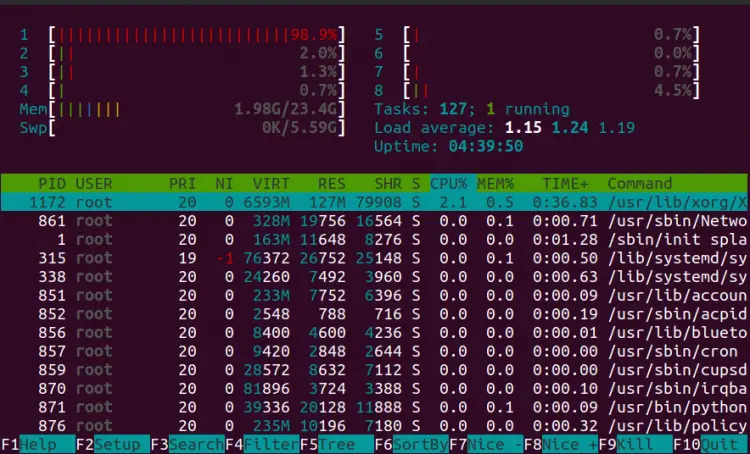
The Htop command displays the data in a more informative and interactive manner. The process names are more descriptive and the mouse integration is an extra feature that is not present with the ‘top’ command. We can use the mouse to select various columns displayed on the terminal output. Another benefit is that it provides color coding to easily grasp over and analyze the output. ‘Htop’ can be installed on Ubuntu 20.04 using the command:
$ sudo apt install htop
To adjust various settings, Htop uses function keys. For e.g. F3 can be used to search the output displayed on the console. To list processes owned by a specific user, the command to use is:
$ htop -u User_Name
For the root user, the command will be:
$ htop -u root

To start Htop in monochrome mode, use:
$ htop -C
4. ps
The ‘ps’ command implementation differs remarkably among different Unix systems, e.g. it may use one flag (option) on one system and another for a different system even though the output may be the same in both cases. In the case of the ‘ps’ command, the output is static unlike the ‘top’ and ‘htop’ where we get real-time updates. When no option is passed, the ‘ps’ command returns the name of the active shell and eventual processes.
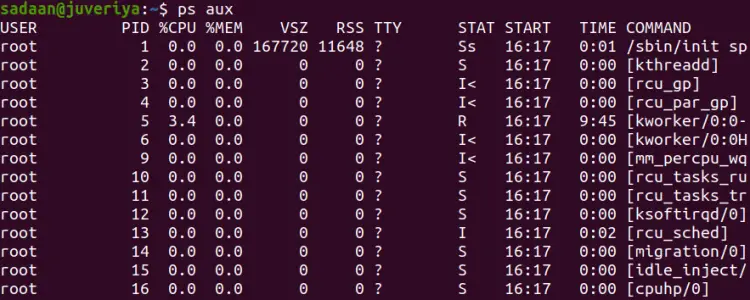
To display all the running processes, including those owned by other users (owners), use the command:
$ ps aux
Since we have used the ‘u’ option, the name of the users will also be displayed. Another way to display the list of processes running on the system is to use the command:
$ ps -A
You would have probably noticed that 'ps' command outputs are generally large. To simplify the analysis or filtering work we can use the ‘grep’ command. For e.g. to filter the ‘/usr/lib/firefox/firefox’ processes, use:
$ ps aux | grep ‘/usr/lib/firefox/firefox/

Similarly, we can redirect the output to a file rather than displaying it on the terminal. Here is an example:
$ ps -aux > output.txt
The above command will direct the output to a file ‘output.txt’.
4. Vmstat
Virtual memory reporter or vmstat gathers data about CPU, virtual memory(swapd), block I/O, disks etc. In case no option is used, it shows the average information about these parameters. The average is taken from the last time the system is rebooted. We can specify a sampling rate after which data will be displayed on the terminal:
$ vmstat 2
Using the ‘-a’ option will give you active and inactive system memory. Like the ‘ps’ command the output of ‘vmstat’ varies across platforms. We can also specify the number of count of measurements:
$ vmstat 1 4

The first parameter ‘1’ specifies the sampling rate and the second parameter ‘4’ gives the number of measurements to be displayed in the output.
Conclusion
This is a brief discussion of four command-line-based tools which are normally used and available on most Linux-based distros. There are still many tools to count on. Each tool has its own pros and limitations and to select a specific tool depends on the point of application. We have just touched the surface to give an overview of these tools, you can find more information and options to use by referring to the man pages.


