How to Install Netdata Monitoring Tool on Ubuntu 18.04 LTS
This tutorial exists for these OS versions
- Ubuntu 22.04 (Jammy Jellyfish)
- Ubuntu 20.04 (Focal Fossa)
- Ubuntu 18.04 (Bionic Beaver)
On this page
Netdata is a free, open source, simple and real-time performance and health monitoring tool with a beautiful web front-end. You can monitor CPU, RAM usage, disk I/O, network traffic, Postfix and much more using Netdata. Netdata gathers real-time performance data from Linux, FreeBSD, MacOS and SNMP devices quickly and effectively.
In this tutorial, we are going to look at how to install Netdata performance Monitoring tool on Ubuntu 18.04 LTS (Bionic Beaver) server.
Requirements
- A server running Ubuntu 18.04 LTS.
- A non-root user with sudo privileges.
Install Netdata
By default, Netdata is available in the Ubuntu 18.04 default repository. You can easily install with the following command:
sudo apt-get install netdata -y
Once Netdata is installed, you can proceed to the next step.
Configure Netdata
By default, Netdata default configuration file located at /etc/netdata/netdata.conf. Now, open the file and change the server loopback address to your server's IP address.
sudo nano /etc/netdata/netdata.conf
Make the following changes:
[global]
        run as user = netdata
        web files owner = root
        web files group = root
        # Netdata is not designed to be exposed to potentially hostile
        # networks.See https://github.com/firehol/netdata/issues/164
        bind socket to IP = 192.168.0.234
Save and close the file, then restart Netdata service to apply the changes:
sudo systemctl restart netdata
You can check the status of Netdata with the following command:
sudo systemctl status netdata
Output:
? netdata.service - netdata - Real-time performance monitoring
   Loaded: loaded (/lib/systemd/system/netdata.service; enabled; vendor preset: enabled)
   Active: active (running) since Thu 2018-08-16 06:03:01 UTC; 3min 29s ago
     Docs: man:netdata
           file:///usr/share/doc/netdata/html/index.html
           https://github.com/firehol/netdata
 Main PID: 3317 (netdata)
    Tasks: 14 (limit: 2855)
   CGroup: /system.slice/netdata.service
           ??3317 /usr/sbin/netdata -D
           ??3350 bash /usr/lib/x86_64-linux-gnu/netdata/plugins.d/tc-qos-helper.sh 1
           ??3353 /usr/lib/x86_64-linux-gnu/netdata/plugins.d/apps.plugin 1

Aug 16 06:03:01 ubuntu1804 systemd[1]: Stopped netdata - Real-time performance monitoring.
Aug 16 06:03:01 ubuntu1804 systemd[1]: Started netdata - Real-time performance monitoring.
Access Netdata Web Interface
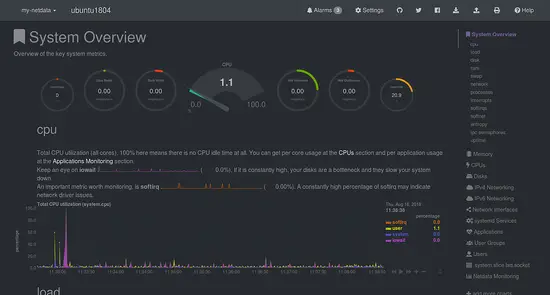
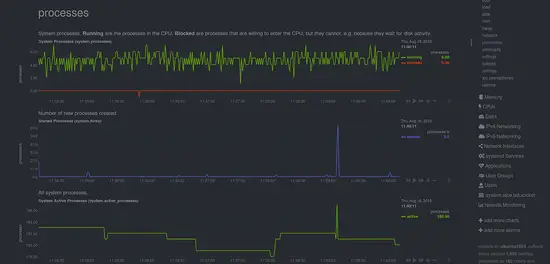
Netdata is now installed and listening on port 19999. Open your web browser and type the URL http://192.168.0.234:19999. You will be redirected to the Netdata default dashboard:
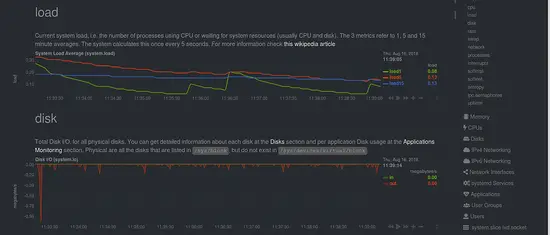
Load and Disk Usage
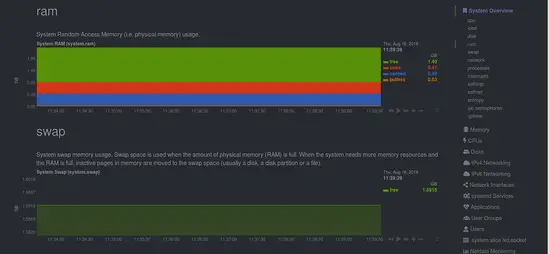
RAM and Swap
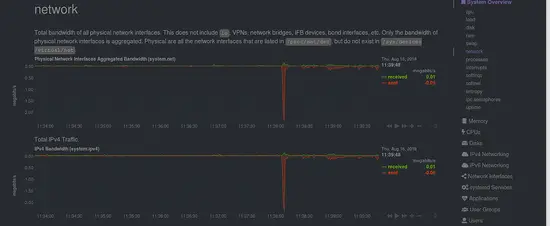
Network Information
Process
Links

