How to Install Grafana Monitoring Tool on Ubuntu 18.04 LTS
This tutorial exists for these OS versions
- Ubuntu 24.04 (Noble Numbat)
- Ubuntu 22.04 (Jammy Jellyfish)
- Ubuntu 20.04 (Focal Fossa)
- Ubuntu 18.04 (Bionic Beaver)
On this page
Grafana is a free and open source enterprise-level monitoring and data visualization tool with support for Graphite, InfluxDB, Prometheus, Elasticsearch and many more databases. You can create your own dashboard to your own apps or infrastructure performance monitoring.
In this tutorial, we will explain how to install Grafana on Ubuntu 18.04 LTS (Bionic Beaver).
Prerequisites
- A server running Ubuntu 18.04 LTS.
- N non-root user with sudo privileges.
Install Grafana
By default, Grafana is not available in Ubuntu 18.04 default repository. So you will need to add Grafana repository to your system. You can add it using the following command:
sudo nano /etc/apt/sources.list
Add the following line at the end of the file:
deb https://packagecloud.io/grafana/stable/debian/ stretch main
Save and close the file, then add the GPG key with the following command:
sudo curl https://packagecloud.io/gpg.key | sudo apt-key add -
Next, update the Grafana repository and install Grafana using the following command:
sudo apt-get update -y
sudo apt-get install grafana -y
Once the installation is completed successfully, you should see the following output:
Preparing to unpack .../grafana_5.1.3_amd64.deb ...
Unpacking grafana (5.1.3) ...
Processing triggers for ureadahead (0.100.0-20) ...
Processing triggers for systemd (237-3ubuntu10) ...
Setting up grafana (5.1.3) ...
Adding system user `grafana' (UID 112) ...
Adding new user `grafana' (UID 112) with group `grafana' ...
Not creating home directory `/usr/share/grafana'.
### NOT starting on installation, please execute the following statements to configure grafana to start automatically using systemd
 sudo /bin/systemctl daemon-reload
 sudo /bin/systemctl enable grafana-server
### You can start grafana-server by executing
 sudo /bin/systemctl start grafana-server
Processing triggers for ureadahead (0.100.0-20) ...
Processing triggers for systemd (237-3ubuntu10) ...
Next, start Grafana server and enable it to start on boot time with the following command:
sudo systemctl daemon-reload
sudo systemctl enable grafana-server
sudo systemctl start grafana-server
Next, check the status of Grafana server using the following command:
sudo systemctl status grafana-server
Output:
? grafana-server.service - Grafana instance
   Loaded: loaded (/usr/lib/systemd/system/grafana-server.service; disabled; vendor preset: enabled)
   Active: active (running) since Wed 2018-06-13 15:43:13 UTC; 11s ago
     Docs: http://docs.grafana.org
 Main PID: 19946 (grafana-server)
    Tasks: 8 (limit: 1114)
   CGroup: /system.slice/grafana-server.service
           ??19946 /usr/sbin/grafana-server --config=/etc/grafana/grafana.ini --pidfile=/var/run/grafana/grafana-server.pid cfg:default.paths.l

Jun 13 15:43:19 ubuntu1804 grafana-server[19946]: t=2018-06-13T15:43:19+0000 lvl=info msg="Executing migration" logger=migrator id="create user
Jun 13 15:43:19 ubuntu1804 grafana-server[19946]: t=2018-06-13T15:43:19+0000 lvl=info msg="Executing migration" logger=migrator id="create inde
Jun 13 15:43:19 ubuntu1804 grafana-server[19946]: t=2018-06-13T15:43:19+0000 lvl=info msg="Executing migration" logger=migrator id="alter user_
Jun 13 15:43:19 ubuntu1804 grafana-server[19946]: t=2018-06-13T15:43:19+0000 lvl=info msg="Created default admin user: admin"
Jun 13 15:43:19 ubuntu1804 grafana-server[19946]: t=2018-06-13T15:43:19+0000 lvl=info msg="Starting plugin search" logger=plugins
Jun 13 15:43:19 ubuntu1804 grafana-server[19946]: t=2018-06-13T15:43:19+0000 lvl=info msg="Plugin dir created" logger=plugins dir=/var/lib/graf
Jun 13 15:43:19 ubuntu1804 grafana-server[19946]: t=2018-06-13T15:43:19+0000 lvl=info msg="Initializing Alerting" logger=alerting.engine
Jun 13 15:43:19 ubuntu1804 grafana-server[19946]: t=2018-06-13T15:43:19+0000 lvl=info msg="Initializing CleanUpService" logger=cleanup
Jun 13 15:43:20 ubuntu1804 grafana-server[19946]: t=2018-06-13T15:43:20+0000 lvl=info msg="Initializing Stream Manager"
Jun 13 15:43:20 ubuntu1804 grafana-server[19946]: t=2018-06-13T15:43:20+0000 lvl=info msg="Initializing HTTP Server" logger=http.server address
lines 1-19/19 (END)
Access Grafana
Grafana is now installed and configured, it's time to access Grafana dashboard.
Open your web browser and type the URL http://your-server-ip:3000, you will be redirected to the following page:
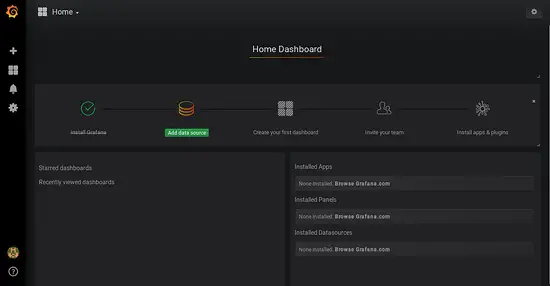
Now, provide your username as admin and password as admin, then click on the Log In button, you should see the Grafana dashboard in the following page:


