How To Install Grafana On Ubuntu 20.04 LTS
This tutorial exists for these OS versions
- Ubuntu 24.04 (Noble Numbat)
- Ubuntu 22.04 (Jammy Jellyfish)
- Ubuntu 20.04 (Focal Fossa)
- Ubuntu 18.04 (Bionic Beaver)
On this page
Grafana is an open source, feature rich metrics dashboard and graph editor. Grafana is widely used to monitor large number of metrics from different data sources like MySQL, MongoDB, InfluxDB etc. It has a pluggable architecture which can be extended with multiple plugins for various data sources.
Grafana is written in Scala language and uses Elasticsearch for persistence and an easy query cross data source. It can be used to visualize metrics from your own applications or third party services like Pingdom, Google Analytics, AWS Cloudwatch etc.
Top Features of Grafana:
- Dashboard Editor: It has a powerful graphical dashboard editor providing drag and drop interface to build dashboards. Grafana also provides API access which allows developers to deploy the dashboards in real time.
- Multiple Data Sources: Grafana supports Graphite, InfluxDB and Prometheus data sources as of now. But it is extensible using plugins for various other data sources like MySQL, Elasticsearch etc. New plugins are added frequently by community members.
- Data Visualizations: It provides various visualization types like Graph, Tables, Charts. It also has a dashboard feature which can make complex dashboards from smaller dashlets.
- Dashboard sharing: Grafana has an integrated dashboard sharer which allows us to create and share our own dashboards online with other users or groups. We have the option of either exporting the shared dashboard as JSON file or downloading it in PNG format.
What does it do?
Now that we have know more about Grafana's features let us see how it works. Graphite is one of the most widely used and popular tool for monitoring metrics. But it has a major shortcoming in the way it collects metrics from data sources. It uses polling mechanism to collect metric values which causes high CPU utilization and takes longer time to process queries from various clients. Grafana uses Collectd on a local host and sends the metrics to InfluxDB as well as Graphite for persistent storage.
How does it work?
Grafana then takes this data from InfluxDB or Graphite and stores them into Elasticsearch, a NoSQL database that allows fast querying of large amount of data across multiple hosts. Grafana then reads these points from Elasticsearch through a pluggable plugin architecture where one can add third party plugins for various data sources. Grafana has plugins for almost all popular data sources and some of them are open sourced like Graphite, InfluxDB, OpenTSDB etc.
This guide will walk you through the process of installing and configuring Grafana on Ubuntu 20.04( it should work with other versions too).
Prerequisite
- A Server with Ubuntu 20.04 64-bit version installed on it.
- Log in as root or user with sudo privileges.
- Sufficient space. Grafanan requires at least 200 MB disk space, at least 3 GB of Ram, and at least 2 CPUs to handle Dashboards and Metrics.
Getting Started
Updating you Server
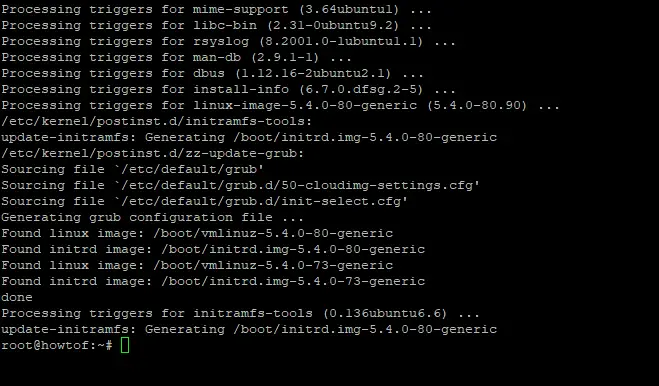
It's always a good idea to update your server before you start installing anything by running the following commands in your terminal:
sudo apt update -y
sudo apt upgrade -y
The -y flag is used to answer yes the prompts that it asks you during the update.
apt update will update your package list, and apt upgrade will install the latest versions of all packages currently installed on the system.
Sample output:
Updating you Server
After the update process is finished, you might need to reboot the server by running the following command in your terminal:
sudo reboot
Installing Dependencies
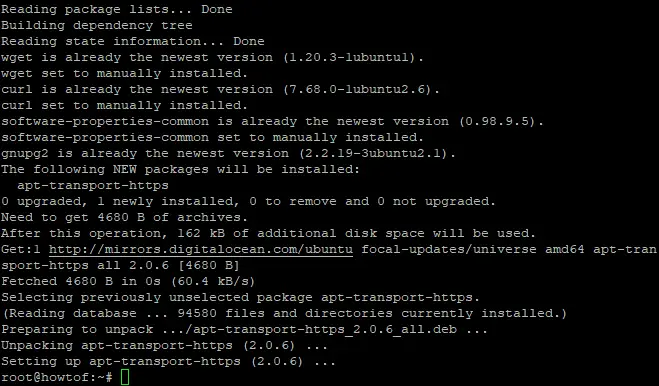
Grafana requires a few packages to be installed before running the installation script. To install these packages, run the following command in your terminal:
sudo apt-get install -y gnupg2 curl software-properties-common apt-transport-https wget -y
gnupg2 is a package that helps in generating the gpg key to be used for signing the packages.
curl is an application that lets you transfer data from or to a server.
apt-transport-https is a package that allows the apt-get command to work with https.
software-properties-common allows us to add Grafana repository and wget will fetch packages from repositories.
These packages will be installed on your server without any confirmation.
Sample output:
Installing Dependencies
Installing Grafana
Now that we have installed all the dependencies required by Grafana, let's install it.
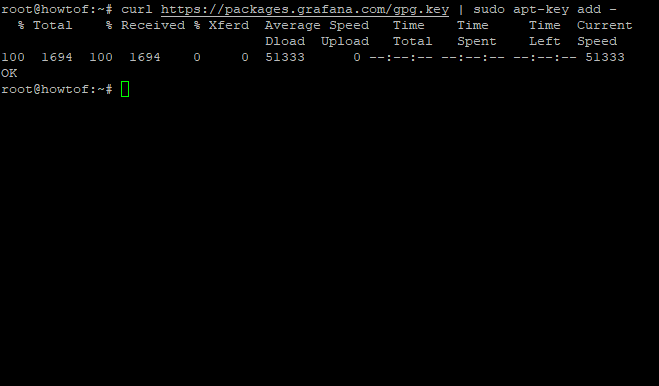
First, we will have to import the Grafana GPG key which will ensure that we are installing the authentic version of Grafana. Run the following command in your terminal:
curl https://packages.grafana.com/gpg.key | sudo apt-key add -
Sample output:
Now we will add the repository to the apt-get source list by running the following command in your terminal:
sudo add-apt-repository "deb https://packages.grafana.com/oss/deb stable main"
Sample output:
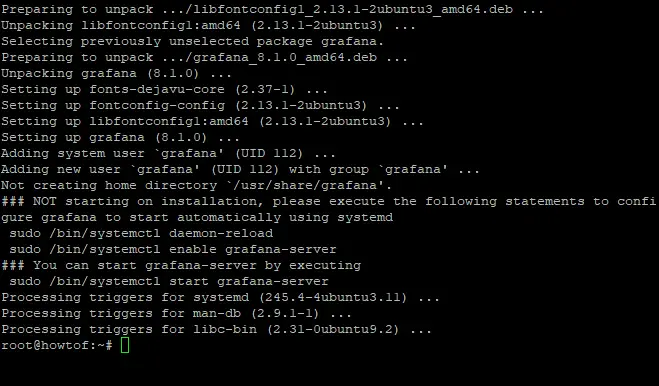
This will install and update all repositories to have the latest version of Grafana. Once it has finished, we can now install Grafana using the following commands:
sudo apt update
sudo apt install grafana -y
Sample output:
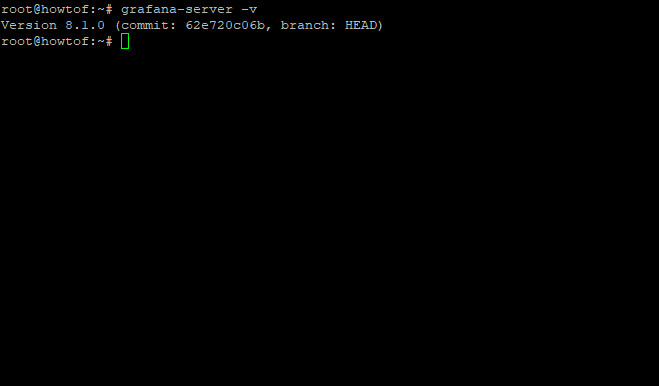
To verify that the installation was successful, run the following command in your terminal:
grafana-server -v
Sample output:
After the installation was completed, the Grafana service will automatically start. If it's not running, run the systemctl commands to start it:
sudo systemctl start grafana-server
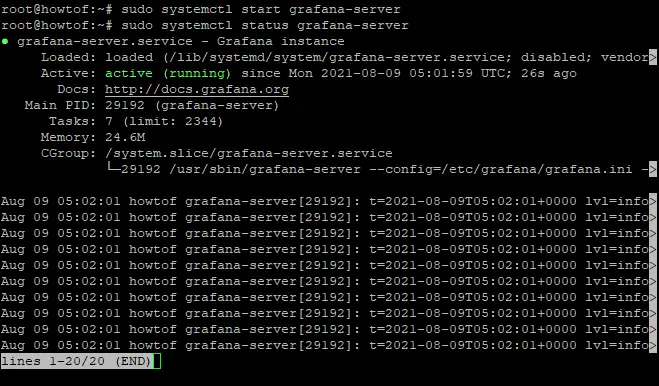
You can check the status of the service using the following commands:
sudo systemctl status grafana-server
The output should look something like this:
This output has information about Grafana's process, including its status and the PID. The process is active, meaning that it is running correctly.
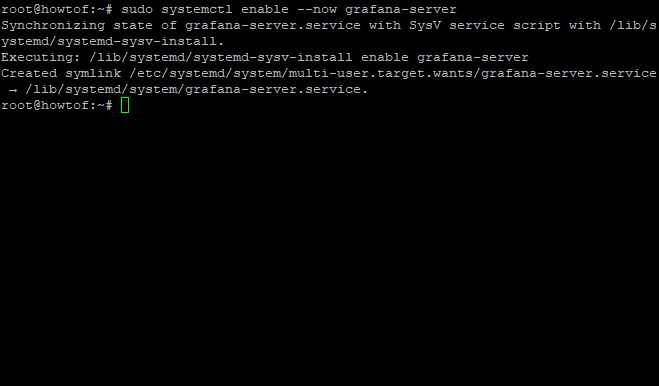
If you want to start the Grafana service at system boot, run the following command:
sudo systemctl enable --now grafana-server
Sample output:
This tells us that systemd has created the symbolic links that will make Grafana autostart.
Configuring Firewall
Grafana is a web application and it requires access to port 3000. Since Ubuntu 20.04 comes with UFW (Uncomplicated Firewall), we will need to configure this accordingly. If you aren't sure if the firewall is running, run the following command in your terminal:
sudo systemctl status ufw
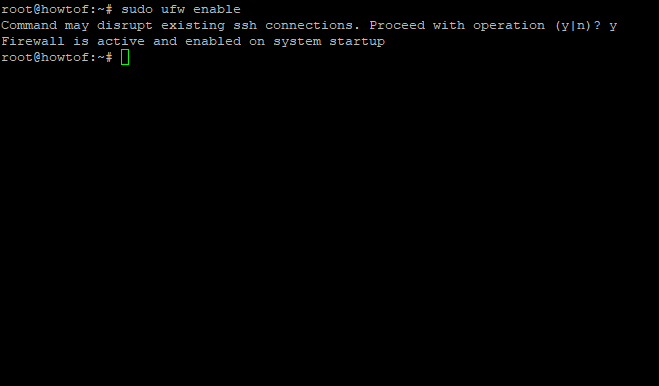
If it's not running, start it using the command below:
sudo ufw enable
sudo systemctl enable ufw
Sample output:
This will start the firewall and enable it to run at every reboot. Now we need to configure the firewall for Grafana access, run the following command in your terminal:
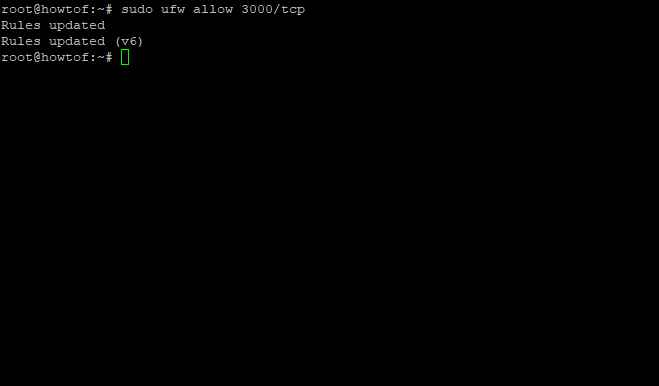
sudo ufw allow 3000/tcp
This command will allow port access to Grafana on port 3000. To verify that the correct firewall rules are in place, run:
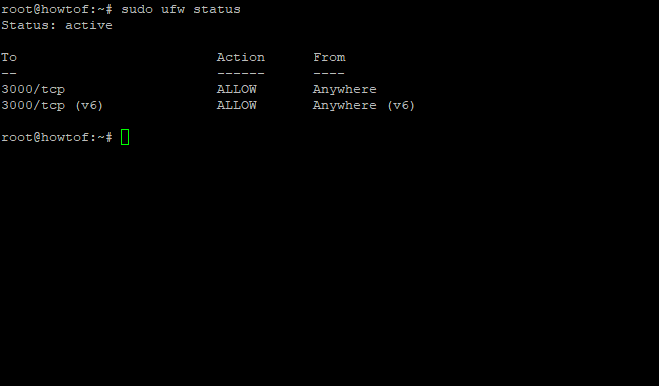
sudo ufw status
The output should look something like this:
Accessing Grafana Web Interface
You have successfully installed a Grafana server. Now you can access it from a browser by visiting http://localhost:3000 if you installed the server on your local computer or http://my-ip-address:3000 if you are accessing Grafana on another computer. Remember to replace "my-ip-address" with the IP address of your server.
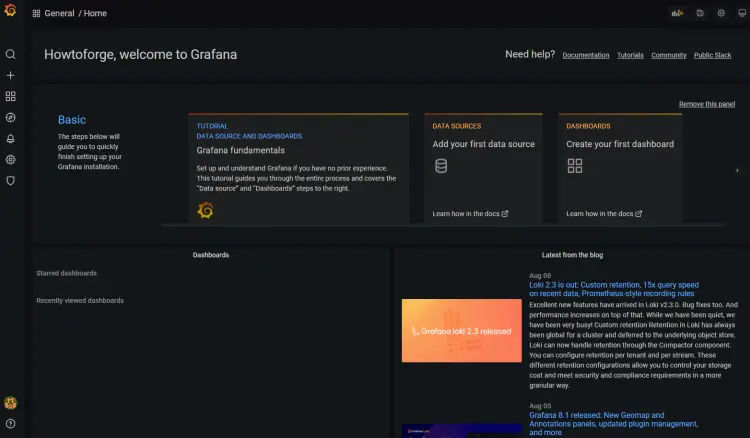
If everything is configured correctly, Grafana web interface will be displayed as shown in the screenshot below:
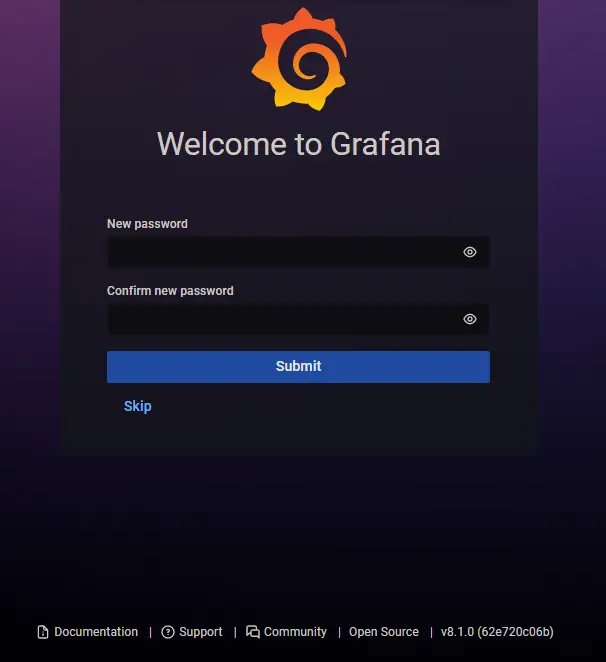
The default Grafana uses an admin user with username admin and password admin, you can log in with those credentials. The first time you log in, you will be asked to change the password. Please create a strong password for your Grafana web interface:
Once logged in, the web page will show a dashboard that contains sample data. You can click on panels to access them and then view more details about metrics or parameters that interest you by clicking on charts or graphs.
Congratulations! You have successfully installed Grafana on your Ubuntu server.
Note: This guide is just a basic installation of Grafana to get the service running. This guide is not intended to be a detailed Grafana tutorial; however, you can find more information by visiting https://grafana.com/docs
Conclusion
Grafana is a great open-source visualization tool for all kinds of data. You can use Grafana to create dashboards that present the data for easy monitoring by your developers and operations team. The Dashboard page in Grafana gives you a convenient way to easily access, search, and create these dashboards.
If you like this article, please share it with your friends on Twitter and Facebook. This will help us to keep writing more articles like this one.
If you have a question or comment, feel free to leave it in the comment section below. Thank you for reading, and see you again!

