How to Install Elasticsearch, Fluentd and Kibana (EFK) Logging Stack on Ubuntu 22.04
On this page
- Prerequisites
- Step 1 - Configure Firewall
- Step 2 - Install Docker and Docker Compose
- Step 3 - Create Docker Compose File
- Step 4 - Set up Fluentd Build Files
- Step 5 - Run the Docker Containers
- Step 6 - Configure Kibana
- Step 7 - Install Nginx
- Step 8 - Install SSL
- Step 9 - Configure Nginx
- Step 10 - Running a Docker container with Fluentd Log Driver
- Conclusion
Log monitoring and analysis is an essential part of server or container infrastructure and is useful when handling complex applications. One of the popular logging solutions is the Elasticsearch, Fluentd, and Kibana (EFK) stack. Before going further into the tutorial, let us learn about the stack's components.
Elasticsearch is a real-time, distributed, and scalable search engine that allows for full-text search and analytics. It is used to index and search through large amounts of data. It is commonly deployed alongside Kibana, a powerful data visualization dashboard for Elasticsearch. Kibana allows you to explore the Elasticsearch log data and build dashboards and queries to gain insight into your application. Fluentd collects, transforms, and ships the log data to the Elasticsearch backend.
In this tutorial, we will install the EFK stack using Docker on a Ubuntu 22.04 machine and send container logs to Kibana after filtering and transforming them using Fluentd.
Prerequisites
-
A server running Ubuntu 22.04 with a minimum of 6GB of RAM.
-
A non-root user with sudo privileges.
-
The uncomplicated Firewall(UFW) is enabled and running.
-
A Fully Qualified domain name (FQDN) pointing to the server like,
kibana.example.com. -
Everything is updated.
$ sudo apt update && sudo apt upgrade
Step 1 - Configure Firewall
Before installing any packages, the first step is configuring the firewall to allow HTTP and HTTPS connections.
Check the status of the firewall.
$ sudo ufw status
You should see something like the following.
Status: active

To                         Action      From
--                         ------      ----
OpenSSH                    ALLOW       Anywhere
OpenSSH (v6)               ALLOW       Anywhere (v6)
Allow HTTP and HTTPs ports.
$ sudo ufw allow http
$ sudo ufw allow https
Check the status again to confirm.
$ sudo ufw status
Status: active

To                         Action      From
--                         ------      ----
OpenSSH                    ALLOW       Anywhere
80/tcp                     ALLOW       Anywhere
443                        ALLOW       Anywhere
OpenSSH (v6)               ALLOW       Anywhere (v6)
80/tcp (v6)                ALLOW       Anywhere (v6)
443 (v6)                   ALLOW       Anywhere (v6)
Step 2 - Install Docker and Docker Compose
Add Docker's official GPG key.
$ curl -fsSL https://download.docker.com/linux/ubuntu/gpg | sudo gpg --dearmor -o /usr/share/keyrings/docker.gpg
Run the following command to add the Docker repository.
$ echo \
  "deb [arch=$(dpkg --print-architecture) signed-by=/usr/share/keyrings/docker.gpg] https://download.docker.com/linux/ubuntu \
  $(lsb_release -cs) stable" | sudo tee /etc/apt/sources.list.d/docker.list > /dev/null
Update the system to include Docker's repository.
$ sudo apt update
Install Docker and the Docker compose plugin.
$ sudo apt install docker-ce docker-ce-cli containerd.io docker-compose-plugin
This tutorial will be using the Docker Compose v2 plugin instead of the older legacy binary. Therefore, the command for running it has changed from docker-compose to docker composeand this is reflected here.
Docker runs with elevated privileges so you will need to use sudo frequently to run commands. The better option is to add your Linux user account to the docker user group.
$ sudo usermod -aG docker ${USER}
The ${USER} variable picks up the currently logged-in system account. If you are not logged in with the user you want to give privileges to, replace ${USER} with the username.
To apply for the new group membership, log out of the server and back in, or use the following command. You will be prompted for the user's password.
$ su - ${USER}
Step 3 - Create Docker Compose File
First, create the directory for the EFK project.
$ mkdir ~/efk
Switch to the directory.
$ cd ~/efk
Create and open the docker-compose.yml file for editing.
$ nano docker-compose.yml
Paste the following code in it.
services:
  # Deploy using the custom image automatically be created during the build process.
  fluentd:
    build: ./fluentd
    volumes:
      - ./fluentd/conf:/fluentd/etc
    links: # Sends incoming logs to the elasticsearch container.
      - elasticsearch
    depends_on:
      - elasticsearch
    ports: # Exposes the port 24224 on both TCP and UDP protocol for log aggregation
      - 24224:24224
      - 24224:24224/udp

  elasticsearch:
    image: elasticsearch:8.7.1
    expose:
      - 9200
    environment:
      - discovery.type=single-node # Runs as a single-node
      - xpack.security.enabled=false
    volumes: # Stores elasticsearch data locally on the esdata Docker volume
      - esdata:/usr/share/elasticsearch/data

  kibana:
    image: kibana:8.7.1
    links: # Links kibana service to the elasticsearch container
      - elasticsearch
    depends_on:
      - elasticsearch
    ports:
      - 5601:5601
    environment: # Defined host configuration
      - ELASTICSEARCH_HOSTS=http://elasticsearch:9200

# Define the Docker volume named esdata for the Elasticsearch container.
volumes:
  esdata:
Save the file by pressing Ctrl + X and entering Y when prompted. We have configured to start three services, one for each, Fluentd, Elasticsearch, and Kibana.
For Fluentd, we will build a container instead of a readymade image. The build files for Fluentd will be set up in the next step. We have mounted a directory for its build files, and a volume for the configuration files, and exposed port 24224 on both TCP and UDP protocol for log aggregation.
The next service is Elasticsearch and we are using the latest version available at the time of writing this tutorial. We have exposed it via port 9200 and set up a few environment variables so that we can run it as a single-node cluster and have disabled the security features. This is not recommended usually but enabling security is out of the scope of this tutorial. We have also mounted a local volume for the Elasticsearch data.
Finally, we configure Kibana and expose it via port 5601 which will be used to access the dashboard. We also set up a variable to configure the Elasticsearch host for it to access.
Step 4 - Set up Fluentd Build Files
Create Fluentd and the configuration directory.
$ mkdir fluentd/conf -p
Run the tree command to verify the directory structure.
$ tree
It should look like the following.

Switch to the Fluentd directory.
$ cd fluentd
Create and open the Dockerfile for editing.
$ nano Dockerfile
Paste the following code in it. This code pulls the Fluentd Debian Docker image and installs the Fluentd plugin for Elasticsearch.
# fluentd/Dockerfile
FROM fluent/fluentd:v1.16-debian-1
USER root
RUN ["gem", "install", "fluent-plugin-elasticsearch", "--no-document", "--version", "5.3.0"]
USER fluent
Save the file by pressing Ctrl + X and entering Y when prompted.
Switch to the configuration directory.
$ cd conf
Create and open the fluentd.conf file for editing.
$ nano fluentd.conf
Paste the following code in it.
# bind fluentd on IP 0.0.0.0
# port 24224
<source>
  @type forward
  port 24224
  bind 0.0.0.0
</source>

# sendlog to the elasticsearch
# the host must match to the elasticsearch
# container service
<match *.**>
  @type copy
  <store>
    @type elasticsearch_dynamic
    hosts elasticsearch:9200
    logstash_format true
    logstash_prefix fluentd
    logstash_dateformat %Y%m%d
    include_tag_key true
    tag_key @log_name
    include_timestamp true
    flush_interval 30s
  </store>
  <store>
    @type stdout
  </store>
</match>
Save the file by pressing Ctrl + X and entering Y when prompted.
The source directive above uses the forward plugin which turns Fluentd into a TCP endpoint to accept TCP packets.
The match directive looks for events with matching tags which in this case means it matches all the events. We will use the elasticsearch_dynamic plugin for storage which allows configuration values to be specified dynamically. The hosts field specifies the hostname for the Elasticsearch application which is the service name in the Docker compose file. The logstash_format is set to true which means Fluentd uses the conventional name format logstash-%Y.%m.%dlogstash-%Y.%m.%d. The prefix name to write the events is set to fluend. The include_tag_key is set to true which adds the Fluentd tag in the JSON format. The tag_key is the field name to extract for the tag. Setting the variable include_timestamp to true adds a timestamp field to the log. The flush_interval specifies the interval between data flushes. We also use the stdout plugin to print events/logs to the standard output.
Step 5 - Run the Docker Containers
Switch back to the EFK directory.
$ cd ~/efk
Start the containers using the following command.
$ docker compose up -d
Check the status of the running containers.
$ docker ps
b3780c311154   efk-fluentd           "tini -- /bin/entryp…"   9 seconds ago   Up 8 seconds   5140/tcp, 0.0.0.0:24224->24224/tcp, 0.0.0.0:24224->24224/udp, :::24224->24224/tcp, :::24224->24224/udp   efk-fluentd-1
5a48f0a9ade1   kibana:8.7.1          "/bin/tini -- /usr/l…"   9 seconds ago   Up 7 seconds   0.0.0.0:5601->5601/tcp, :::5601->5601/tcp                                                                efk-kibana-1
dab3a0ab0312   elasticsearch:8.7.1   "/bin/tini -- /usr/l…"   9 seconds ago   Up 8 seconds   9200/tcp, 9300/tcp                                                                                       efk-elasticsearch-1
You can also use the following command for it.
$ docker compose ps
NAME                  IMAGE                 COMMAND                  SERVICE             CREATED             STATUS              PORTS
efk-elasticsearch-1   elasticsearch:8.7.1   "/bin/tini -- /usr/l…"   elasticsearch       37 seconds ago      Up 36 seconds       9200/tcp, 9300/tcp
efk-fluentd-1         efk-fluentd           "tini -- /bin/entryp…"   fluentd             37 seconds ago      Up 36 seconds       5140/tcp, 0.0.0.0:24224->24224/tcp, 0.0.0.0:24224->24224/udp, :::24224->24224/tcp, :::24224->24224/udp
efk-kibana-1          kibana:8.7.1          "/bin/tini -- /usr/l…"   kibana              37 seconds ago      Up 36 seconds       0.0.0.0:5601->5601/tcp, :::5601->5601/tcp
Run the following commands to check the logs of the EFK build process.
$ docker logs efk-fluentd-1
$ docker logs efk-kibana-1
$ docker logs efk-elasticsearch-1
Inspect the Elasticsearch container. It will print out the detailed settings of the container.
$ docker inspect efk-elasticsearch-1
You can notice the IP address given to the container.
[
    {
        "Id": "dab3a0ab03120d3a7192045e1ea84fdd0f8fdb7819cc6d6780e05109d61e0b66",
        "Created": "2023-05-04T09:58:00.256169904Z",
        "Path": "/bin/tini",
        "Args": [
            "--",
            "/usr/local/bin/docker-entrypoint.sh",
            "eswrapper"
        ],
        "State": {
            "Status": "running",
            "Running": true,
            "Paused": false,
            "Restarting": false,
            "OOMKilled": false,
            "Dead": false,
            "Pid": 23619,
            "ExitCode": 0,
            "Error": "",
            "StartedAt": "2023-05-04T09:58:00.563700803Z",
            "FinishedAt": "0001-01-01T00:00:00Z"
        },
        "Image": "sha256:59075530be34d3a06866f894ae9735f6d739a7a751ad45efb86dec3c9bd16836",
        "ResolvConfPath": "/var/lib/docker/containers/dab3a0ab03120d3a7192045e1ea84fdd0f8fdb7819cc6d6780e05109d61e0b66/resolv.conf",
        "HostnamePath": "/var/lib/docker/containers/dab3a0ab03120d3a7192045e1ea84fdd0f8fdb7819cc6d6780e05109d61e0b66/hostname",
        "HostsPath": "/var/lib/docker/containers/dab3a0ab03120d3a7192045e1ea84fdd0f8fdb7819cc6d6780e05109d61e0b66/hosts",
        "LogPath": "/var/lib/docker/containers/dab3a0ab03120d3a7192045e1ea84fdd0f8fdb7819cc6d6780e05109d61e0b66/dab3a0ab03120d3a7192045e1ea84fdd0f8fdb7819cc6d6780e05109d61e0b66-json.log",
        "Name": "/efk-elasticsearch-1",
        "RestartCount": 0,
        "Driver": "overlay2",
        "Platform": "linux",
        "MountLabel": "",
        "ProcessLabel": "",
        "AppArmorProfile": "docker-default",
        "ExecIDs": null,
        "HostConfig": {
            "Binds": null,
            "ContainerIDFile": "",
            "LogConfig": {
                "Type": "json-file",
                "Config": {}
            },
            "NetworkMode": "efk_default",
            "PortBindings": {},
            "RestartPolicy": {
                "Name": "",
                "MaximumRetryCount": 0
            },
            "AutoRemove": false,
            "VolumeDriver": "",
            "VolumesFrom": null,
            "ConsoleSize": [
                0,
                0
            ],
            "CapAdd": null,
            "CapDrop": null,
            "CgroupnsMode": "private",
            "Dns": null,
            "DnsOptions": null,
            "DnsSearch": null,
            "ExtraHosts": [],
            "GroupAdd": null,
            "IpcMode": "private",
            "Cgroup": "",
            "Links": null,
            "OomScoreAdj": 0,
            "PidMode": "",
            "Privileged": false,
            "PublishAllPorts": false,
            "ReadonlyRootfs": false,
            "SecurityOpt": null,
            "UTSMode": "",
            "UsernsMode": "",
            "ShmSize": 67108864,
            "Runtime": "runc",
            "Isolation": "",
            "CpuShares": 0,
            "Memory": 0,
            "NanoCpus": 0,
            "CgroupParent": "",
            "BlkioWeight": 0,
            "BlkioWeightDevice": null,
            "BlkioDeviceReadBps": null,
            "BlkioDeviceWriteBps": null,
            "BlkioDeviceReadIOps": null,
            "BlkioDeviceWriteIOps": null,
            "CpuPeriod": 0,
            "CpuQuota": 0,
            "CpuRealtimePeriod": 0,
            "CpuRealtimeRuntime": 0,
            "CpusetCpus": "",
            "CpusetMems": "",
            "Devices": null,
            "DeviceCgroupRules": null,
            "DeviceRequests": null,
            "MemoryReservation": 0,
            "MemorySwap": 0,
            "MemorySwappiness": null,
            "OomKillDisable": null,
            "PidsLimit": null,
            "Ulimits": null,
            "CpuCount": 0,
            "CpuPercent": 0,
            "IOMaximumIOps": 0,
            "IOMaximumBandwidth": 0,
            "Mounts": [
                {
                    "Type": "volume",
                    "Source": "efk_esdata",
                    "Target": "/usr/share/elasticsearch/data",
                    "VolumeOptions": {}
                }
            ],
            "MaskedPaths": [
                "/proc/asound",
                "/proc/acpi",
                "/proc/kcore",
                "/proc/keys",
                "/proc/latency_stats",
                "/proc/timer_list",
                "/proc/timer_stats",
                "/proc/sched_debug",
                "/proc/scsi",
                "/sys/firmware"
            ],
            "ReadonlyPaths": [
                "/proc/bus",
                "/proc/fs",
                "/proc/irq",
                "/proc/sys",
                "/proc/sysrq-trigger"
            ]
        },
        "GraphDriver": {
            "Data": {
                "LowerDir": "/var/lib/docker/overlay2/ee03648cf34e03601848b1769569b4d3bb7192db118102ca050215ba87060bbf-init/diff:/var/lib/docker/overlay2/51d6cfcb59e473a3f163e68984a1ba1325a2c816ed7925c4dffdefcf2e104d11/diff:/var/lib/docker/overlay2/b9c096454bda31f1cb2ea33f108be8b29b2e94827ebe94cc17563eb596b7cab1/diff:/var/lib/docker/overlay2/effe604c5b015ba02cf3b7a238bd3ff5dad7970a72e689ef5275fcf03fd0bcd1/diff:/var/lib/docker/overlay2/72fbf23251467ea2f6af8d9458c7fdd8fa3ef716eeafd9319ceff59d07d96788/diff:/var/lib/docker/overlay2/02094ec9e4ebb04371f782744a3a46852a00bf6fd7e8820d466a3576aeb9d5fc/diff:/var/lib/docker/overlay2/ce364cdd636b67e10c879aa152360d965d08fe456663ed8fbe78c3bd37bde6c7/diff:/var/lib/docker/overlay2/33bf44b475ea5ea249845b7eed75ded47dd9dc7877b9231fa4195b4753071945/diff:/var/lib/docker/overlay2/4f19bd8089599ef879075012c710ec464d8e0446fc0a0813850657dddd23a5dc/diff:/var/lib/docker/overlay2/a39a61b12d8565c6d5b33c17a04d47c8bd47609a787e0548fbac0d47d00eecc8/diff:/var/lib/docker/overlay2/cbd9d77eb9ed6b600511f9a676aab511d2aa2b3dbd18d5403559699558546996/diff",
                "MergedDir": "/var/lib/docker/overlay2/ee03648cf34e03601848b1769569b4d3bb7192db118102ca050215ba87060bbf/merged",
                "UpperDir": "/var/lib/docker/overlay2/ee03648cf34e03601848b1769569b4d3bb7192db118102ca050215ba87060bbf/diff",
                "WorkDir": "/var/lib/docker/overlay2/ee03648cf34e03601848b1769569b4d3bb7192db118102ca050215ba87060bbf/work"
            },
            "Name": "overlay2"
        },
        "Mounts": [
            {
                "Type": "volume",
                "Name": "efk_esdata",
                "Source": "/var/lib/docker/volumes/efk_esdata/_data",
                "Destination": "/usr/share/elasticsearch/data",
                "Driver": "local",
                "Mode": "z",
                "RW": true,
                "Propagation": ""
            }
        ],
        "Config": {
            "Hostname": "dab3a0ab0312",
            "Domainname": "",
            "User": "elasticsearch:root",
            "AttachStdin": false,
            "AttachStdout": true,
            "AttachStderr": true,
            "ExposedPorts": {
                "9200": {},
                "9200/tcp": {},
                "9300/tcp": {}
            },
            "Tty": false,
            "OpenStdin": false,
            "StdinOnce": false,
            "Env": [
                "xpack.security.enabled=false",
                "discovery.type=single-node",
                "PATH=/usr/share/elasticsearch/bin:/usr/local/sbin:/usr/local/bin:/usr/sbin:/usr/bin:/sbin:/bin",
                "ELASTIC_CONTAINER=true"
            ],
            "Cmd": [
                "eswrapper"
            ],
            "Image": "elasticsearch:8.7.1",
            "Volumes": null,
            "WorkingDir": "/usr/share/elasticsearch",
            "Entrypoint": [
                "/bin/tini",
                "--",
                "/usr/local/bin/docker-entrypoint.sh"
            ],
            "OnBuild": null,
            "Labels": {
                "com.docker.compose.config-hash": "51c818791aa87ea7eccc389578c76ec4d596265eba8baefb8833bf5df13777e3",
                "com.docker.compose.container-number": "1",
                "com.docker.compose.depends_on": "",
                "com.docker.compose.image": "sha256:59075530be34d3a06866f894ae9735f6d739a7a751ad45efb86dec3c9bd16836",
                "com.docker.compose.oneoff": "False",
                "com.docker.compose.project": "efk",
                "com.docker.compose.project.config_files": "/home/navjot/efk/docker-compose.yml",
                "com.docker.compose.project.working_dir": "/home/navjot/efk",
                "com.docker.compose.service": "elasticsearch",
                "com.docker.compose.version": "2.17.3",
                "org.label-schema.build-date": "2023-04-27T04:33:42.127815583Z",
                "org.label-schema.license": "Elastic-License-2.0",
                "org.label-schema.name": "Elasticsearch",
                "org.label-schema.schema-version": "1.0",
                "org.label-schema.url": "https://www.elastic.co/products/elasticsearch",
                "org.label-schema.usage": "https://www.elastic.co/guide/en/elasticsearch/reference/index.html",
                "org.label-schema.vcs-ref": "f229ed3f893a515d590d0f39b05f68913e2d9b53",
                "org.label-schema.vcs-url": "https://github.com/elastic/elasticsearch",
                "org.label-schema.vendor": "Elastic",
                "org.label-schema.version": "8.7.1",
                "org.opencontainers.image.created": "2023-04-27T04:33:42.127815583Z",
                "org.opencontainers.image.documentation": "https://www.elastic.co/guide/en/elasticsearch/reference/index.html",
                "org.opencontainers.image.licenses": "Elastic-License-2.0",
                "org.opencontainers.image.ref.name": "ubuntu",
                "org.opencontainers.image.revision": "f229ed3f893a515d590d0f39b05f68913e2d9b53",
                "org.opencontainers.image.source": "https://github.com/elastic/elasticsearch",
                "org.opencontainers.image.title": "Elasticsearch",
                "org.opencontainers.image.url": "https://www.elastic.co/products/elasticsearch",
                "org.opencontainers.image.vendor": "Elastic",
                "org.opencontainers.image.version": "8.7.1"
            }
        },
        "NetworkSettings": {
            "Bridge": "",
            "SandboxID": "bf47cd7764585766349085d35100611e086cf233fc9fc655c6eb9e086f1cd59a",
            "HairpinMode": false,
            "LinkLocalIPv6Address": "",
            "LinkLocalIPv6PrefixLen": 0,
            "Ports": {
                "9200/tcp": null,
                "9300/tcp": null
            },
            "SandboxKey": "/var/run/docker/netns/bf47cd776458",
            "SecondaryIPAddresses": null,
            "SecondaryIPv6Addresses": null,
            "EndpointID": "",
            "Gateway": "",
            "GlobalIPv6Address": "",
            "GlobalIPv6PrefixLen": 0,
            "IPAddress": "",
            "IPPrefixLen": 0,
            "IPv6Gateway": "",
            "MacAddress": "",
            "Networks": {
                "efk_default": {
                    "IPAMConfig": null,
                    "Links": null,
                    "Aliases": [
                        "efk-elasticsearch-1",
                        "elasticsearch",
                        "dab3a0ab0312"
                    ],
                    "NetworkID": "1bc8ac0185982b84a24a201852f2cddc0432a3ffff1a2bd4008074875f696cac",
                    "EndpointID": "e1c67199e679f350d1da47f0b1e208ec6a7767eb57d60f773ba08b88a6962dcf",
                    "Gateway": "172.23.0.1",
                    "IPAddress": "172.23.0.2",
                    "IPPrefixLen": 16,
                    "IPv6Gateway": "",
                    "GlobalIPv6Address": "",
                    "GlobalIPv6PrefixLen": 0,
                    "MacAddress": "02:42:ac:17:00:02",
                    "DriverOpts": null
                }
            }
        }
    }
]
As you can see, the container got 172.23.0.2 as the IP address. Run the following command to verify whether Elasticsearch is working correctly.
$ curl 172.23.0.2:9200
{
  "name" : "dab3a0ab0312",
  "cluster_name" : "docker-cluster",
  "cluster_uuid" : "gldMFBtQSxS5sL93rBAdzA",
  "version" : {
    "number" : "8.7.1",
    "build_flavor" : "default",
    "build_type" : "docker",
    "build_hash" : "f229ed3f893a515d590d0f39b05f68913e2d9b53",
    "build_date" : "2023-04-27T04:33:42.127815583Z",
    "build_snapshot" : false,
    "lucene_version" : "9.5.0",
    "minimum_wire_compatibility_version" : "7.17.0",
    "minimum_index_compatibility_version" : "7.0.0"
  },
  "tagline" : "You Know, for Search"
}
Step 6 - Configure Kibana
Now that the EFK stack is deployed, it is time to configure Kibana. Open the URL http://<yourserverIP>:5601 in the browser.
Click the Explore on my own button to proceed to the Kibana dashboard.
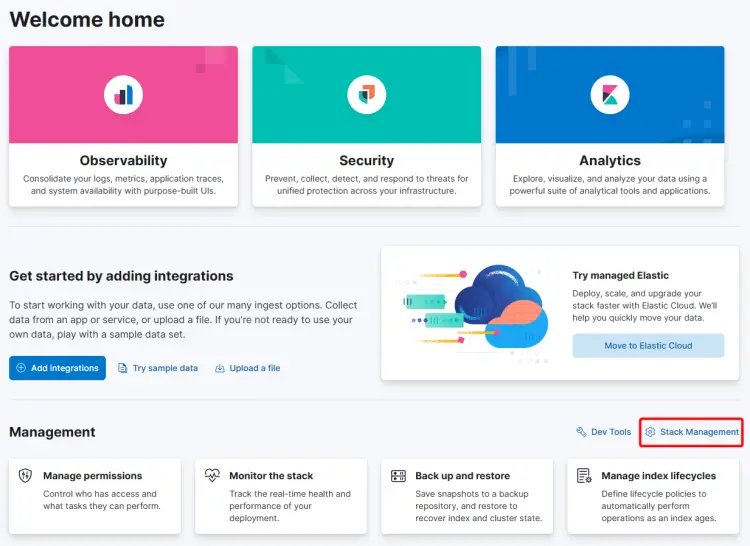
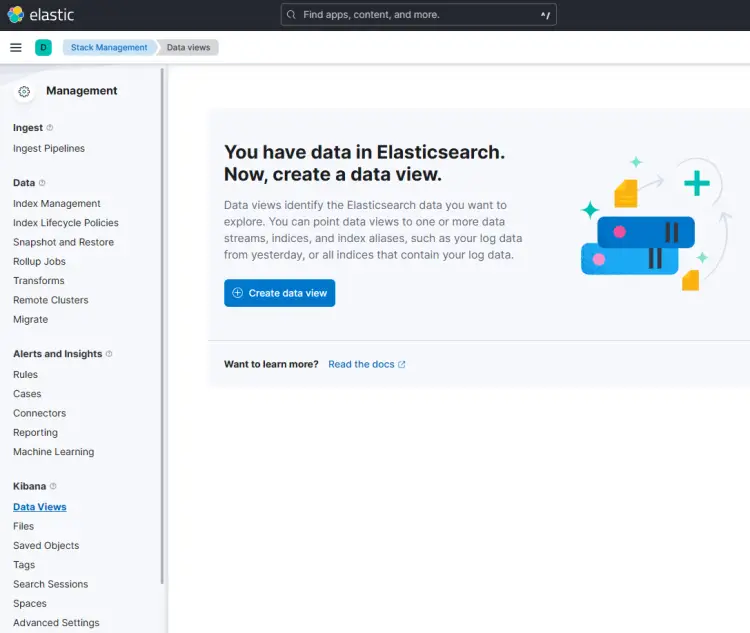
Click the Stack Management link to set up the Kibana data view. Select the option Kibana >> Data Views from the left sidebar to open the data view page.
Click the Create data view button to proceed.
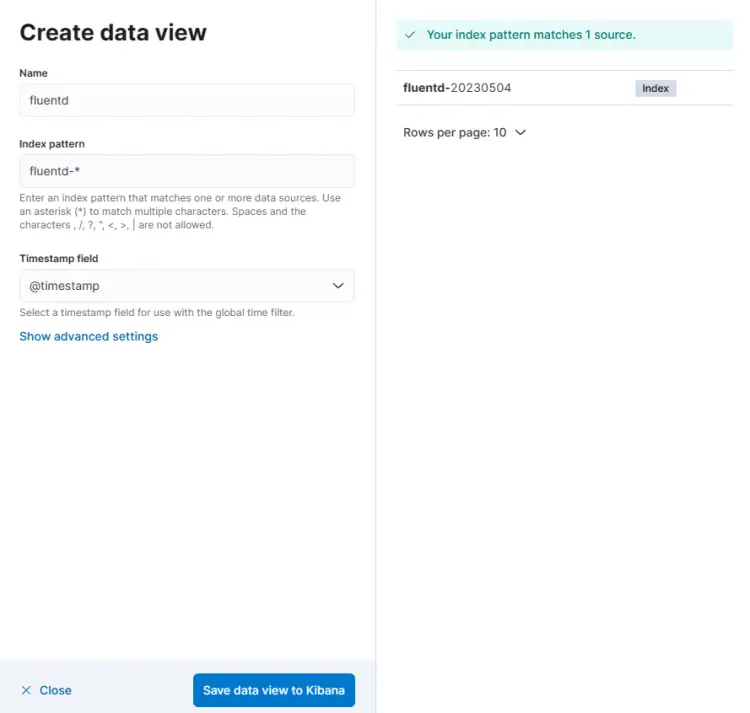
Enter the name of the data view and the index pattern as fluentd-*. Make sure the Timestamp field is set to @timestamp. The source field will be automatically updated. Click the Save data view to Kibana button to finish creating the data view.
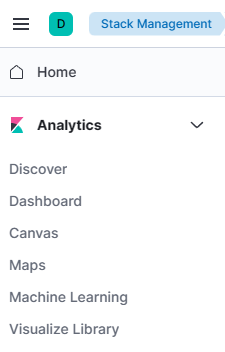
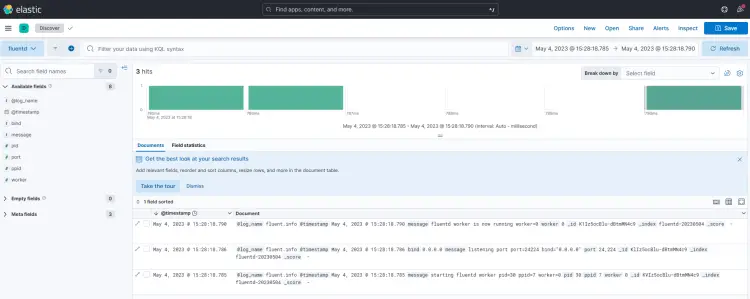
Next, click on the top menu (ellipsis), and click on the Discover option to show the logs monitoring.
You will get the following page confirming that your setup is working perfectly. The logs are all taken from Elasticsearch and shipped by the Fluentd log aggregation.
Step 7 - Install Nginx
Ubuntu 22.04 ships with an older version of Nginx. You need to download the official Nginx repository to install the latest version.
Import Nginx's signing key.
$ curl https://nginx.org/keys/nginx_signing.key | gpg --dearmor \
| sudo tee /usr/share/keyrings/nginx-archive-keyring.gpg >/dev/null
Add the repository for Nginx's stable version.
$ echo "deb [signed-by=/usr/share/keyrings/nginx-archive-keyring.gpg arch=amd64] \
http://nginx.org/packages/ubuntu `lsb_release -cs` nginx" \
| sudo tee /etc/apt/sources.list.d/nginx.list
Update the system repositories.
$ sudo apt update
Install Nginx.
$ sudo apt install nginx
Verify the installation.
$ nginx -v
nginx version: nginx/1.24.0
Start the Nginx server.
$ sudo systemctl start nginx
Step 8 - Install SSL
The first step is to install the Let's Encrypt SSL Certificate. We need to install Certbot to generate the SSL certificate. You can either install Certbot using Ubuntu's repository or grab the latest version using the Snapd tool. We will be using the Snapd version.
Ubuntu 22.04 comes with Snapd installed by default. Run the following commands to ensure that your version of Snapd is up to date.
$ sudo snap install core && sudo snap refresh core
Install Certbot.
$ sudo snap install --classic certbot
Use the following command to ensure that the Certbot command can be run by creating a symbolic link to the /usr/bin directory.
$ sudo ln -s /snap/bin/certbot /usr/bin/certbot
Generate the SSL certificate for the domain kibana.example.com.
$ sudo certbot certonly --nginx --agree-tos --no-eff-email --staple-ocsp --preferred-challenges http -m [email protected] -d kibana.example.com
The above command will download a certificate to the /etc/letsencrypt/live/kibana.example.com directory on your server.
Generate a Diffie-Hellman group certificate.
$ sudo openssl dhparam -dsaparam -out /etc/ssl/certs/dhparam.pem 4096
Check the Certbot renewal scheduler service.
$ sudo systemctl list-timers
You will find snap.certbot.renew.service as one of the services scheduled to run.
NEXT                        LEFT          LAST                        PASSED         UNIT                     ACTIVATES
------------------------------------------------------------------------------------------------------------------------------------
Mon 2023-05-06 13:37:57 UTC 3h 45min left Mon 2023-05-01 07:20:42 UTC 2h 31min ago   ua-timer.timer           ua-timer.service
Mon 2023-05-06 14:39:29 UTC 4h 47min left Sat 2023-02-04 16:04:18 UTC 2 months ago   motd-news.timer          motd-news.service
Mon 2023-05-06 15:53:00 UTC 6h left       n/a                         n/a            snap.certbot.renew.timer snap.certbot.renew.service
Do a dry run of the process to check whether the SSL renewal is working fine.
$ sudo certbot renew --dry-run
If you see no errors, you are all set. Your certificate will renew automatically.
Step 9 - Configure Nginx
Create and open the Nginx configuration file for Kibana.
$ sudo nano /etc/nginx/conf.d/kibana.conf
Paste the following code in it. Replace the IP address with the private IP address of your Elasticsearch server.
server {
        listen 80; listen [::]:80;
        server_name kibana.example.com;
        return 301 https://$host$request_uri;
}

server {
        server_name kibana.example.com;
        charset utf-8;

        listen 443 ssl http2;
        listen [::]:443 ssl http2;

        access_log /var/log/nginx/kibana.access.log;
        error_log /var/log/nginx/kibana.error.log;

        ssl_certificate /etc/letsencrypt/live/kibana.example.com/fullchain.pem;
        ssl_certificate_key /etc/letsencrypt/live/kibana.example.com/privkey.pem;
        ssl_trusted_certificate /etc/letsencrypt/live/kibana.example.com/chain.pem;
        ssl_session_timeout 1d;
        ssl_session_cache shared:MozSSL:10m;
        ssl_session_tickets off;

        ssl_protocols TLSv1.2 TLSv1.3;
        ssl_ciphers ECDHE-ECDSA-AES128-GCM-SHA256:ECDHE-RSA-AES128-GCM-SHA256:ECDHE-ECDSA-AES256-GCM-SHA384:ECDHE-RSA-AES256-GCM-SHA384:ECDHE-ECDSA-CHACHA20-POLY1305:ECDHE-RSA-CHACHA20-POLY1305:DHE-RSA-AES128-GCM-SHA256:DHE-RSA-AES256-GCM-SHA384;

		resolver 8.8.8.8;

        ssl_stapling on;
        ssl_stapling_verify on;
        ssl_dhparam /etc/ssl/certs/dhparam.pem;

        location / {
                proxy_pass http://localhost:5601;
                proxy_set_header Host $host;
                proxy_set_header X-Real-IP $remote_addr;
                proxy_set_header X-Forwarded-For $proxy_add_x_forwarded_for;
                proxy_set_header X-Forwarded-Proto $scheme;
        }
}
Save the file by pressing Ctrl + X and entering Y when prompted.
Open the file /etc/nginx/nginx.conf for editing.
$ sudo nano /etc/nginx/nginx.conf
Add the following line before the line include /etc/nginx/conf.d/*.conf;.
server_names_hash_bucket_size 64;
Save the file by pressing Ctrl + X and entering Y when prompted.
Verify the configuration.
$ sudo nginx -t
nginx: the configuration file /etc/nginx/nginx.conf syntax is ok
nginx: configuration file /etc/nginx/nginx.conf test is successful
Restart the Nginx service.
$ sudo systemctl restart nginx
There is one more step needed. Open the Docker compose file for editing.
$ nano ~/docker-compose.yml
Paste the line SERVER_PUBLICBASEURL=https://kibana.example.com under the environment section under the Kibana service as follows.
    environment: # Defined host configuration
      - ELASTICSEARCH_HOSTS=http://elasticsearch:9200
      - SERVER_PUBLICBASEURL=https://kibana.example.com
Save the file by pressing Ctrl + X and entering Y when prompted once you are done.
Stop and remove the containers.
$ docker compose down --remove-orphans
Start the containers again with the updated configuration.
$ docker compose up -d
Your Kibana dashboard should be accessible via the URL https://kibana.example.com from anywhere you want.
Step 10 - Running a Docker container with Fluentd Log Driver
Now, we will run a Docker container with Fluentd log drive, automatically sending logs to the stack. We will test using the Nginx container.
Pull the Nginx image from the Docker Hub registry. We are using the alpine version because it is the smallest version of the image.
$ docker pull nginx:alpine
Run the following command to create and start the Nginx container. We have set the log driver to Fluentd and the port as 8080 because the default port 80 is already in use by the Nginx server in proxy mode.
$ docker run --name nginx-fluentd-test -d --log-driver=fluentd -p 8080:80 nginx:alpine
Check the container status.
$ docker ps
CONTAINER ID   IMAGE                 COMMAND                  CREATED          STATUS          PORTS                                                                                                    NAMES
038c43e4e1a3   nginx:alpine          "/docker-entrypoint.…"   12 seconds ago   Up 11 seconds   0.0.0.0:8080->80/tcp, :::8080->80/tcp                                                                    nginx-fluentd-test
a94ca706bd0c   efk-fluentd           "tini -- /bin/entryp…"   8 hours ago      Up 8 hours      5140/tcp, 0.0.0.0:24224->24224/tcp, 0.0.0.0:24224->24224/udp, :::24224->24224/tcp, :::24224->24224/udp   efk-fluentd-1
0cf04a446425   kibana:8.7.1          "/bin/tini -- /usr/l…"   8 hours ago      Up 8 hours      0.0.0.0:5601->5601/tcp, :::5601->5601/tcp                                                                efk-kibana-1
7c7ad8f9b123   elasticsearch:8.7.1   "/bin/tini -- /usr/l…"   8 hours ago      Up 8 hours      9200/tcp, 9300/tcp                                                                                       efk-elasticsearch-1
Run the following command to access the Nginx container and generate access logs.
$ curl localhost:8080
<!DOCTYPE html>
<html>
<head>
<title>Welcome to nginx!</title>
<style>
html { color-scheme: light dark; }
body { width: 35em; margin: 0 auto;
font-family: Tahoma, Verdana, Arial, sans-serif; }
</style>
</head>
<body>
<h1>Welcome to nginx!</h1>
<p>If you see this page, the nginx web server is successfully installed and
working. Further configuration is required.</p>

<p>For online documentation and support please refer to
<a href="http://nginx.org/">nginx.org</a>.<br/>
Commercial support is available at
<a href="http://nginx.com/">nginx.com</a>.</p>

<p><em>Thank you for using nginx.</em></p>
</body>
</html>
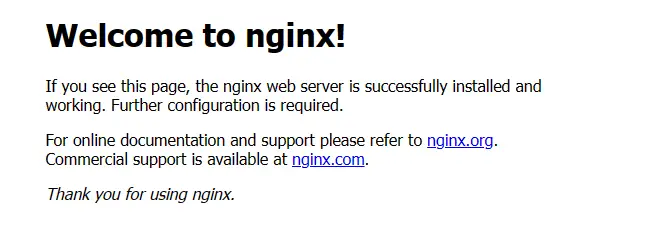
Alternatively, you can open the URL http://<yourserverIP>:8080 in your browser and you will get the following page.
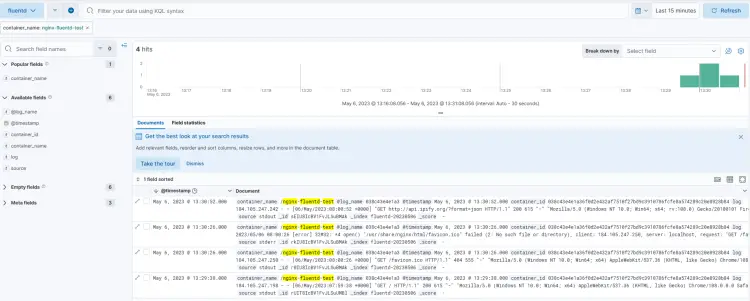
Open the Kibana dashboard and click on the Discover link on the left sidebar menu. Click the + sign in the top menu to bring up the Add filter popup.
Select the field container_name from the dropdown, is as the operator and fill in the container name ( nginx-fluentd-test) as the field value.
Click the Add filter button to visualize the data from the Nginx container.
Conclusion
This concludes our tutorial on installing the Elasticsearch, Fluentd, and Kibana (EFK) logging stack on a Ubuntu 22.04 machine. If you have any questions, post them in the comments below.


