How to Monitor MySQL or MariaDB with Prometheus and Grafana
To ensure the MySQL/MariaDB server is working properly, you need to implement monitoring on your infrastructure. This allows you to optimize performance, identify issues/bottlenecks, and ensure your database is healthy. With Prometheus and Grafana, you can achieve those and create beautiful dashboard monitoring for MySQL servers.
In this guide, you'll learn how to monitor MySQL/MariaDB servers with Prometheus and Grafana. You'll set up 'prometheus-mysqld-exporter' to generate metrics and add the endpoint monitoring to the Prometheus server. After that, you'll create a new Grafana dashboard for MySQL monitoring.
Prerequisites
To get started, make sure you have the following:
- A MySQL/MariaDB server installed
- A non-root user with administrator privileges
- Prometheus and Grafana installed on your server
Setup MySQL/MariaDB user
To monitor the MySQL/MariaDB server, you need to create a new dedicated MySQL user. This user will have the least privileges, such as PROCESS, REPLICATION CLIENT, and SELECT on all of your databases.
In this section, you'll be creating a new MySQL user for monitoring your MySQL server.
Log in to your MySQL/MariaDB server with the following. Enter your 'root' password when prompted.
sudo mysql -u root -p
Now run the following queries to create a new MySQL user 'prometheus' with the 'unix_socket' authentication. This user will have privileges to see processes, replication clients, and select in all databases in the MySQL server.
CREATE USER IF NOT EXISTS 'prometheus'@'localhost' IDENTIFIED WITH unix_socket;
GRANT PROCESS, REPLICATION CLIENT, SELECT ON *.* TO 'prometheus'@'localhost';
FLUSH PRIVILEGES;
Next, run the query below to check the MySQL user 'prometheus@localhost'. You'll see the 'prometheus' user with privileges of SELECT, PROCESS, and BINLOG MONITOR as a replication client.
SHOW GRANTS FOR 'prometheus'@'localhost';
Type 'quit' to exit from the MySQL/MariaDB server.
Installing prometheus-mysqld-exporter
The 'prometheus-mysqld-exporter' is an exporter for MySQL metrics. It supports MySQL >= 5.6 and MariaDB >= 10.3. To use the 'prometheus-mysqld-exporter', you need to install it on your MySQL server.
In this example, the MySQL server is running on the Debian 12 server. And by default, the 'prometheus-mysqld-exporter' is available on the official Debian repository, so we'll install it through APT. If you're using another distro, you can download and install it manually for GitHub.
First, run the command below to update your Debian package index.
sudo apt update
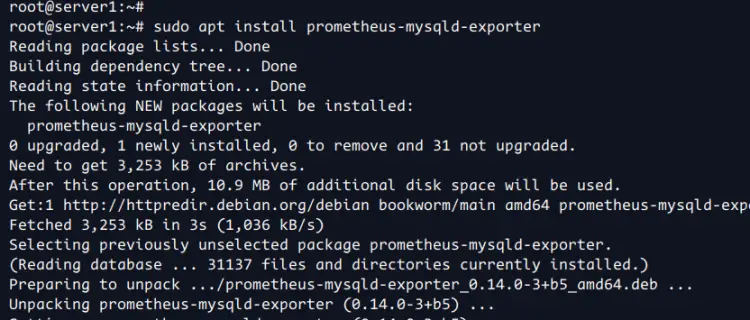
Once the repository is updated, install the 'prometheus-mysqld-exporter' package with the following command. Enter 'Y' to confirm the installation.
sudo apt install prometheus-mysqld-exporter
After the installation is complete, run the 'systemctl' command below to reload the systemd manager.
sudo systemctl daemon-reload
Then, you can start and enable the 'prometheus-mysqld-exporter' service with the command below. With this, the 'prometheus-mysqld-exporter' service should be running and enabled on your system.
sudo systemctl enable --now prometheus-mysqld-exporter
Adding MySQL user to the prometheus-mysqld-exporter
Now that you've created a MySQL user and installed 'prometheus-mysqld-exporter'. The next step is to add your MySQL to the 'prometheus-mysqld-exporter' configuration. Doing this allows you to generate metrics of your MySQL server and expose the endpoint on the default port '9104'.
Open the file '/etc/default/prometheus-mysqld-exporter' with the following 'nano' editor.
sudo nano /etc/default/prometheus-mysqld-exporter
Uncomment the 'DATA_SOURCE_NAME' environment variable to integrate MySQL with the 'prometheus-mysqld-exporter'. In this example, the MySQL user 'prometheus' will be used to monitor the MySQL server through the 'mysqld.sock' file.
DATA_SOURCE_NAME="prometheus@unix(/run/mysqld/mysqld.sock)/"
Save the file and exit the editor.
Now run the 'systemctl' command below to restart the 'prometheus-mysqld-exporter' service and apply your changes. And then, check its status to ensure it is running.
sudo systemctl restart prometheus-mysqld-exporter
sudo systemctl status prometheus-mysqld-exporter
You can see below the 'prometheus-mysqld-exporter' is running.
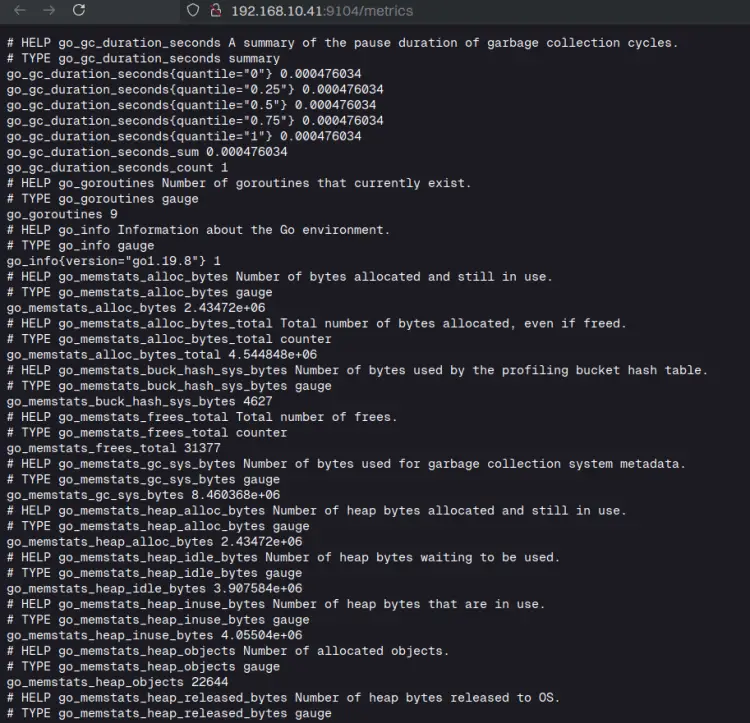
Lastly, open your web browser and visit http://192.168.10.41:9104/. This is the default endpoint for the 'prometheus-mysqld-exporter'. If your configuration is successful, a metric will be generated and will be shown like the following:
Adding prometheus-mysqld-exporter endpoint to the Prometheus
Now that the 'prometheus-mysqld-exporter' configuration is complete and the metric is generated. Now you need to add the 'prometheus-mysqld-exporter' as an endpoint to your Prometheus server. As for this guide, the 'prometheus-mysqld-exporter' endpoint is available at '192.168.10.41:9104'.
If you don't have a Prometheus server, install it through How to Install Prometheus and Node Exporter on Debian 12
Move to your Prometheus server and open the configuration '/etc/prometheus/prometheus.yml' file with the 'nano' editor.
sudo nano /etc/prometheus/prometheus.yml
Within the 'scrape_configs', add the endpoint of your 'prometheus-mysqld-exporter' like this. For this example, the 'prometheus-mysqld-exporter' is running on the 'server1' with the IP address and port '192.168.10.41:9104'.
scrape_configs:

- job_name: server1
static_configs:
- targets: ['192.168.10.41:9104']
labels:
alias: db1
Save the file and exit the editor when done.
Now run the following 'systemctl' command to restart the 'prometheus' service and apply your changes.
sudo systemctl restart prometheus
Lastly, open your Prometheus server dashboard, and select the 'Status > Targets' menu. Make sure you can see the 'server1', which is the endpoint of your MySQL monitoring.
Setting up Grafana Dashboard for MySQL server
After adding the 'prometheus-mysqld-exporter' endpoint to the Prometheus server, you're now ready to build the Grafana dashboard for MySQL server monitoring. In this section, you'll import the dashboard monitoring for MySQL via GrafanaLabs.
If you don't have Grafana installed, install it with How to Install Grafana and Prometheus on Ubuntu 24.04
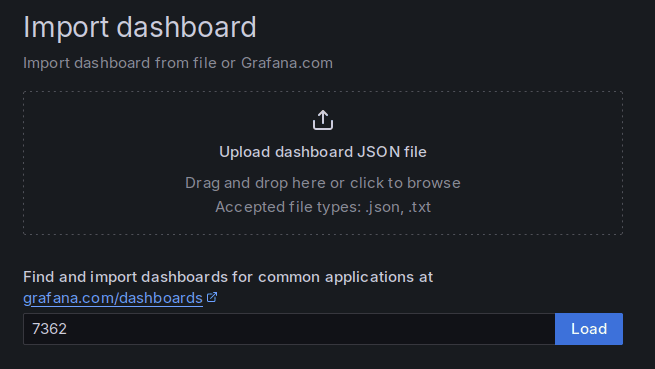
On your Grafana dashboard, click the 'Dashboard > New > Import' menu. For this example, we'll be using Grafana templates from GrafanaLabs for monitoring the MySQL server.
Copy the Grafana ID number and paste, then click 'Load' to confirm.
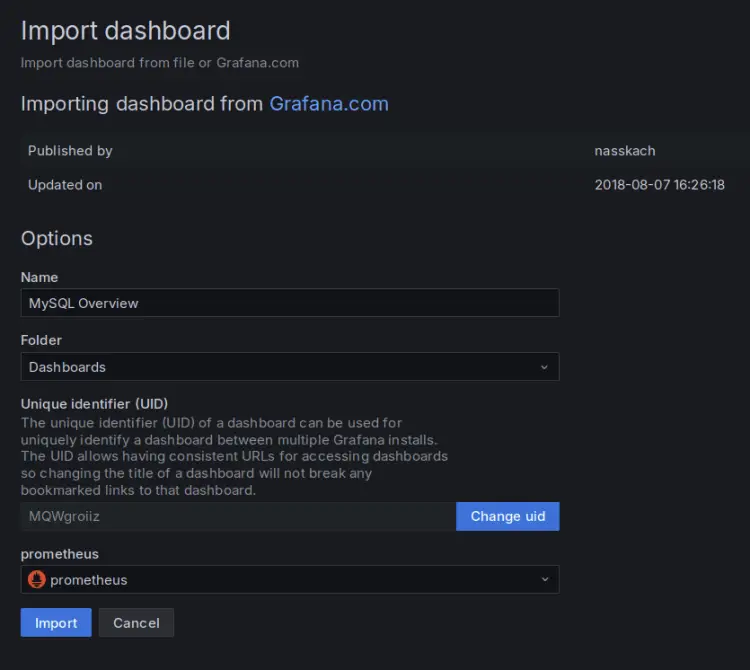
Now select 'Prometheus' as your data source and click 'Import'.
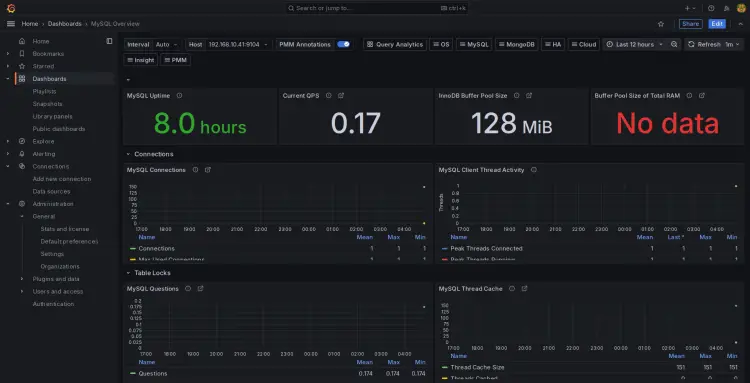
If successful, you'll see the dashboard for your MySQL/MariaDB monitoring with Prometheus and Grafana.
Conclusion
Congratulations! You've completed monitoring the MySQL/MariaDB server with Prometheus and Grafana. You've monitored the MySQL server with the 'prometheus-mysqld-exporter' and generated metrics for MySQL. You've also added the 'prometheus-mysqld-exporter' as an endpoint to your Prometheus server. Lastly, you've created a Grafana dashboard to monitor your MySQL server.


