How to Install TIG Stack (Telegraf, InfluxDB, and Grafana) on Ubuntu 18.04 LTS
This tutorial exists for these OS versions
- Ubuntu 22.04 (Jammy Jellyfish)
- Ubuntu 18.04 (Bionic Beaver)
On this page
InfluxDB is an open-source time series database written in Go. Optimized for fast, high-availability storage and used as a data store for any use case involving large amounts of time-stamped data, including DevOps monitoring, log data, application metrics, IoT sensor data, and real-time analytics.
Telegraf is an agent for collecting, processing, aggregating, and writing metrics. It supports various output plugins such as influxdb, Graphite, Kafka, OpenTSDB etc.
Grafana is an open source data visualization and monitoring suite. It offers support for Graphite, Elasticsearch, Prometheus, influxdb, and many more databases. The tool provides a beautiful dashboard and metric analytics, with the ability to manage and create your own dashboard for your apps or infrastructure performance monitoring.
In this tutorial, I will show you how to install and configure the TIG Stack (Telegraf, influxdb, and Grafana) using a single Ubuntu 18.04 Server. We will be using the TIG Stack for monitoring the system loads such as Network, RAM Memory, Uptime etc.
Prerequisites
- Ubuntu 18.04
- Root privileges
What we will do?
- Install InfluxDB
- Create InfluxDB Database and User
- Install Telegraf Agent
- Configure Telegraf
- Install Grafana
- Setup Grafana Data Source
- Setup Grafana Dashboard
Step 1 - Install InfluxDB
In this first step, we will install the time series database influxdb on the Ubuntu system. We will install both 'influxdb' and the 'telegraf' from the same 'influxdata' Repository, both software were created by the same organization.
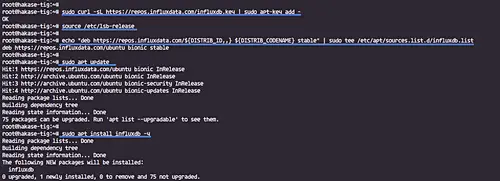
Add the influxdata Key.
sudo curl -sL https://repos.influxdata.com/influxdb.key | sudo apt-key add -
Add the influxdata repository.
source /etc/lsb-release
echo "deb https://repos.influxdata.com/${DISTRIB_ID,,} ${DISTRIB_CODENAME} stable" | sudo tee /etc/apt/sources.list.d/influxdb.list
Now update the repository and install the 'influxdb' package using the apt command below.
sudo apt update
sudo apt install influxdb -y
After the installation is complete, start the influxdb service and enable it to launch every time at system boot.
sudo systemctl start influxdb
sudo systemctl enable influxdb
Now check the opened ports on the system.
netstat -plntu
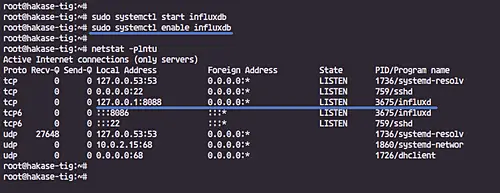
And make sure you get influxdb ports '8088'and '8086' on the 'LISTEN' state.
Step 2 - Create InfluxDB Database and User
In order to store all data from telegraf agents, we need to set up the influxdb database and user.
InfluxDB provides the CLI tool named 'influx' for interacting with an InfluxDB server. Influx command is like the 'mysql' on MySQL, and 'mongo' on the MongoDB database.
Run the 'influx' command below.
influx
Now you are connected to the default influxdb server on port '8086'.
Create a new database and user 'telegraf' with the password 'hakase-ndlr' by running influxdb queries below.
create database telegraf
create user telegraf with password 'hakase-ndlr'
Now check the database and user.
show databases
show users
Make sure you get the database and user named 'telegraf' on the influxdb server.

Step 3 - Install Telegraf Agent
Telegraf was created by 'influxdata', same organization which created the influxdb. So when we add the influxdata key and repository to the system, it means we can install both applications.
Install the telegraf package using the apt command below.
sudo apt install telegraf -y
After the installation is complete, start the telegraf service and enable it to launch everytime at system startup.
sudo systemctl start telegraf
sudo systemctl enable telegraf
The telegraf agent is up and running, check it using the command below.
sudo systemctl status telegraf

Step 4 - Configure Telegraf
Telegraf is a plugin-driven agent and has 4 concept plugins type.
- Using the 'Input Plugins' to collect metrics.
- Using the 'Processor Plugins' to transform, decorate, and filter metrics.
- Using the 'Aggregator Plugins' to create and aggregate metrics.
- And using the 'Output Plugins' to write metrics to various destinations, including influxdb.
In this step, we will configure the Telegraf to use basic input plugins for collecting system metric of the server and using the influxdb as the output plugin.
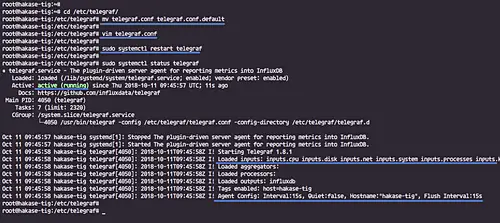
Go to the '/etc/telegraf' directory and rename the default configuration file.
cd /etc/telegraf/
mv telegraf.conf telegraf.conf.default
Now create a new other configuration 'telegraf.conf' using vim editor.
vim telegraf.conf
Paste configurations below.
# Global Agent Configuration
[agent]
  hostname = "hakase-tig"
  flush_interval = "15s"
  interval = "15s"


# Input Plugins
[[inputs.cpu]]
    percpu = true
    totalcpu = true
    collect_cpu_time = false
    report_active = false
[[inputs.disk]]
    ignore_fs = ["tmpfs", "devtmpfs", "devfs"]
[[inputs.io]]
[[inputs.mem]]
[[inputs.net]]
[[inputs.system]]
[[inputs.swap]]
[[inputs.netstat]]
[[inputs.processes]]
[[inputs.kernel]]

# Output Plugin InfluxDB
[[outputs.influxdb]]
  database = "telegraf"
  urls = [ "http://127.0.0.1:8086" ]
  username = "telegraf"
  password = "hakase-ndlr"
Save and exit.
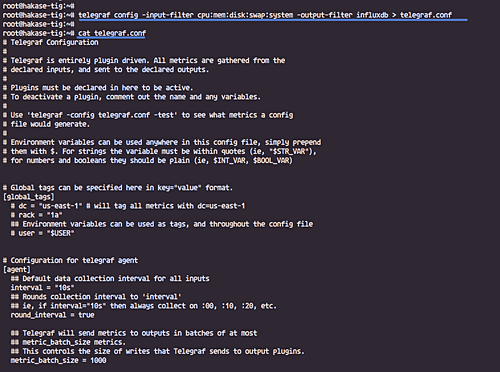
Note:
Telegraf provides telegraf command to manage the configuration, including generate the configuration itself, run the command as below.
telegraf config -input-filter cpu:mem:disk:swap:system -output-filter influxdb > telegraf.conf
cat telegraf.conf
Restart the telegraf service and make sure there is no error.
sudo systemctl restart telegraf
Now test the telegraf settings using the command below.
sudo telegraf -test -config /etc/telegraf/telegraf.conf --input-filter cpu
sudo telegraf -test -config /etc/telegraf/telegraf.conf --input-filter net
sudo telegraf -test -config /etc/telegraf/telegraf.conf --input-filter mem

The InfluxDB and Telegraf configuration has been completed.
Step 6 - Install Grafana
In this step, we will install the beautiful Grafana Dashboard for data visualization.
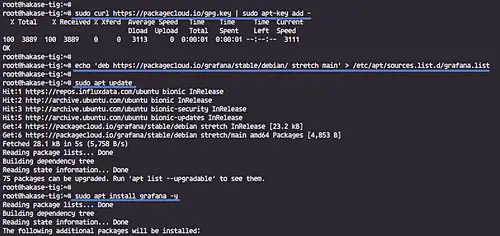
Add the grafana key and repository.
sudo curl https://packagecloud.io/gpg.key | sudo apt-key add -
echo 'deb https://packagecloud.io/grafana/stable/debian/ stretch main' > /etc/apt/sources.list.d/grafana.list
Update the repository and install the grafana package using the apt command below.
sudo apt update
sudo apt install grafana -y
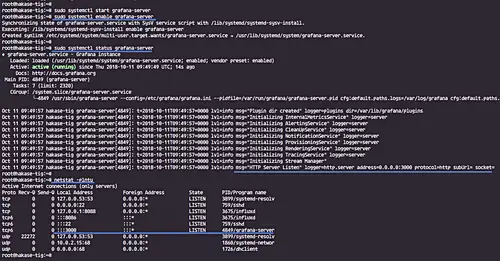
After the installation is complete, start the grafana service and enable it to launch everytime at system boot.
sudo systemctl start grafana-server
sudo systemctl enable grafana-server
The grafana-server is up and running on default port '3000', check it using netstat.
netstat -plntu
And you will get the result as below.
Step 7 - Setup Grafana Data Source
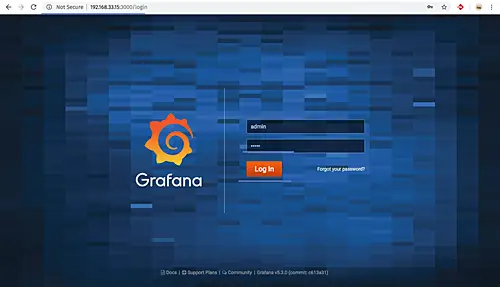
Open your web browser and type the server IP address with port 3000.
Login with the default user 'admin' and password 'admin'.
Now you will be prompted with the page for changing the default password, type your new password and click the 'Save' button.

And you will be redirected to the default Grafana Dashboard.
Click the 'Add data source' button to add the influxdb data source.

Type details about the influxdb server configurations.
- Name: influxdb
- Type: influxdb
- URL: http://localhost:8086/

Scroll to the bottom page and type details of influxdb database settings.
- Database: telegraf
- User: telegraf
- Password: 'hakase-ndlr'

Click the 'Save and Test' button and make sure you get the 'Data source is working' result.
The InfluxDB data source has been added to the Grafana server.
Step 8 - Setup Grafana Dashboard
After adding the influxdb as a data source to the grafana server, in this step we will import the grafana dashboard based on our Telegraf input plugins setup.
Grafana provides the repository for grafana plugins and dashboards.
To import the grafana dashboard, click on the '+' menu on the left panel and click 'Import'.

Now open the sample Grafana dashboard from URL 'https://grafana.com/dashboards/5955' and click the 'Copy the ID to Clipboard' button.
Paste the dashboard id.

And you will be redirected automatically to the dashboard setup.
On the options section, click the InfluxDB and choose your influxdb server, then click 'Import' button.

And below are some screenshots from the imported dashboard.
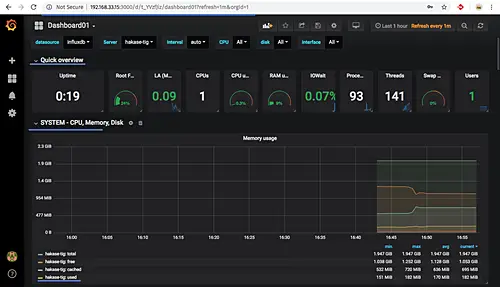
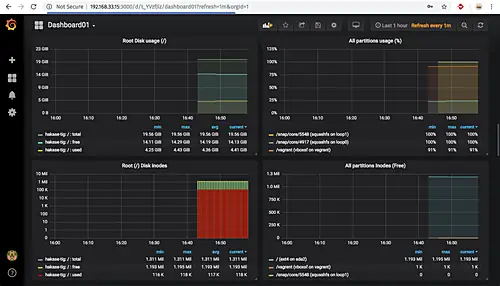
The TIG Stack (Telegraf, InfluxDB, and Grafana) installation on Ubuntu 18.04 has been completed successfully.

