Linux strace Command Tutorial for Beginners (8 Examples)
On this page
- Q1. How to use strace command?
- Q2. How to comprehend strace output?
- Q3. How to make strace print instruction pointer?
- Q4. How to make strace print timestamp for each system call?
- Q5. How to prefix each output line with clock time?
- Q6. How to make strace show time spent in system calls?
- Q7. How to make strace print a summary instead of usual output?
- Conclusion
The Linux command line offers many tools that are helpful for software developers. One among them is strace, a command to trace Linux system calls and signals. The strace basics of which we'll be discussing in this tutorial using some easy-to-understand examples.
But before we do that, it's worth mentioning that all examples in this article have been tested on an Ubuntu 22.04 LTS and Debian 11 machine.
Linux strace command
The strace command in Linux lets you trace system calls and signals. Following is its syntax:
strace [OPTIONS] command
And here's how the tool's man page explains it:
       In  the simplest case strace runs the specified command until it exits.
       It intercepts and records the  system  calls  which  are  called  by  a
       process  and  the signals which are received by a process.  The name of
       each system call, its arguments and its return  value  are  printed  on
       standard error or to the file specified with the -o option.

       strace is a useful diagnostic, instructional, and debugging tool.  Sys?
       tem administrators, diagnosticians and trouble-shooters  will  find  it
       invaluable  for  solving problems with programs for which the source is
       not readily available since they do not need to be recompiled in  order
       to trace them.  Students, hackers and the overly-curious will find that
       a great deal can be learned about a system  and  its  system  calls  by
       tracing  even  ordinary programs.  And programmers will find that since
       system calls and signals are events  that  happen  at  the  user/kernel
       interface,  a close examination of this boundary is very useful for bug
       isolation, sanity checking and attempting to capture race conditions.
The following are some Q&A-styled examples that should give you a better idea of how the strace command works.
Installing strace command
The strace command is not installed by Default on most systems, to install it on Debian and Ubuntu, run this command:
sudo apt-get install strace
Q1. How to use strace command?
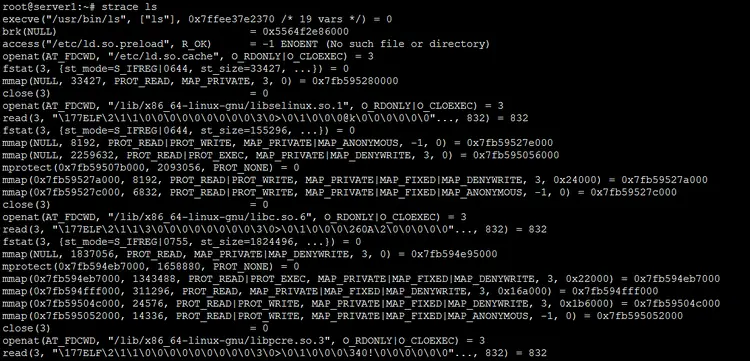
Basic usage is simple, just execute 'strace' with a command as input. For example, I used it with the ls command:
strace ls
And here's the output produced on my system:
Q2. How to comprehend strace output?
As you can see in the screenshot in the previous section, the strace command produces a lot of output. So you need to be aware of how to comprehend it.
The following excerpts from the man page provide a to-the-point explanation:
       Each line in the trace contains the system call name, followed  by  its
       arguments  in parentheses and its return value.  An example from strac?
       ing the command "cat /dev/null" is:

           open("/dev/null", O_RDONLY) = 3

       Errors (typically a return value of -1) have the errno symbol and error
       string appended.

           open("/foo/bar", O_RDONLY) = -1 ENOENT (No such file or directory)

       Signals are printed as signal symbol and decoded siginfo structure.  An
       excerpt from stracing and interrupting the command "sleep 666" is:

           sigsuspend([] <unfinished ...>
           --- SIGINT {si_signo=SIGINT, si_code=SI_USER, si_pid=...} ---
           +++ killed by SIGINT +++
Q3. How to make strace print instruction pointer?
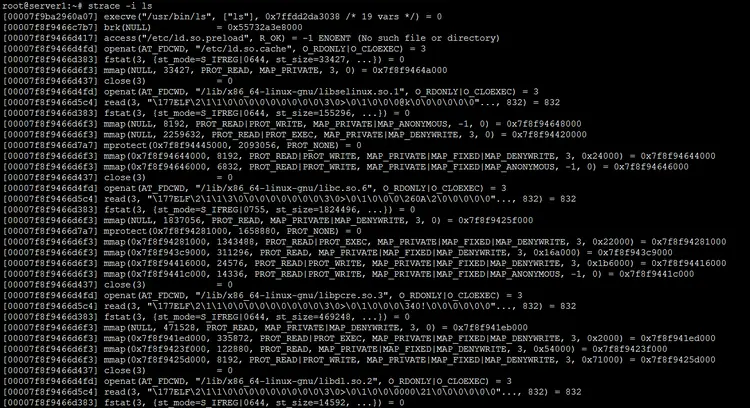
There's an option -i that tells strace to print instruction pointer at the time of system call.
For example:
strace -i ls
Here's the output:
So you can see that the instruction pointer was printed in each line in the output.
Q4. How to make strace print timestamp for each system call?
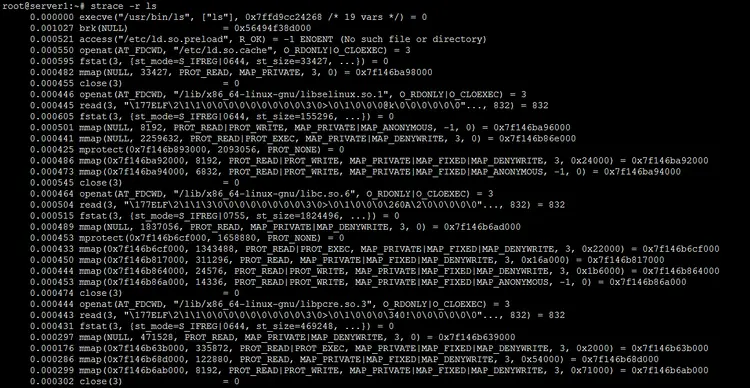
There exists a -r command-line option that tells strace to display a relative timestamp upon entry to each system call. The tool's man page says this records the time difference between the beginning of successive system calls.
For example:
strace -r ls
Following is the output produced by this command:
So you can see that a relative timestamp was produced in the beginning of every line.
Q5. How to prefix each output line with clock time?
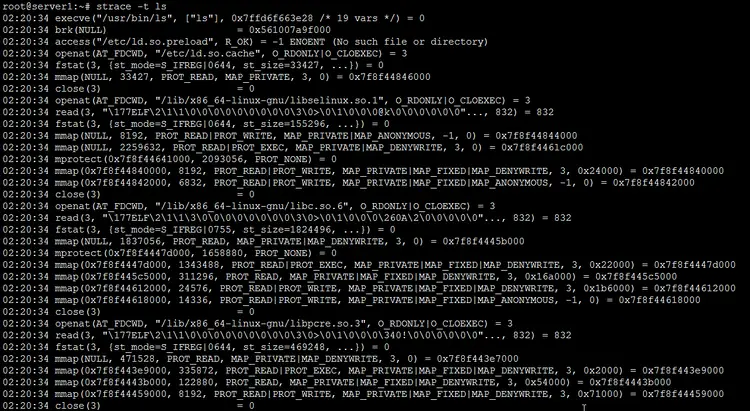
If you want each line in strace output to start with clock time, then this can be done using the -t command line option.
For example:
strace -t ls
Here's the output of this command on my system:
So you can see that system time got printed at the beginning of each line.
Note that there are two more related options strace offers:
-tt
If given twice, the time printed will include the microseconds.

-ttt
If given thrice, the  time  printed  will  include  the microseconds and the leading portion will
be printed as the number of seconds since the epoch.
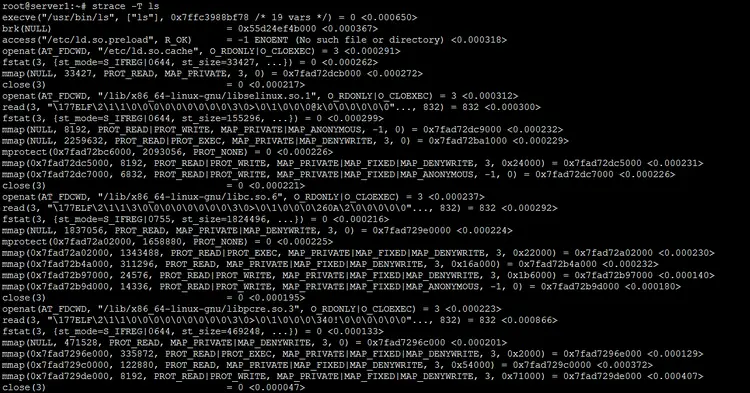
Q6. How to make strace show time spent in system calls?
This can be achieved using the -T command-line option.
For example:
strace -T ls
Following is the output:
So you can see the time spent in system calls is printed at the end of each line.
Q7. How to make strace print a summary instead of usual output?
The -c command line output can be used if you want the tool to produce a summary.
For example, the following command:
strace -c ls
produced this output on my system:
% time     seconds  usecs/call     calls    errors syscall
------ ----------- ----------- --------- --------- ----------------
 93.66    0.000133           5        28           write
  6.34    0.000009           1        11           close
  0.00    0.000000           0         7           read
  0.00    0.000000           0        10           fstat
  0.00    0.000000           0        17           mmap
  0.00    0.000000           0        12           mprotect
  0.00    0.000000           0         1           munmap
  0.00    0.000000           0         3           brk
  0.00    0.000000           0         2           rt_sigaction
  0.00    0.000000           0         1           rt_sigprocmask
  0.00    0.000000           0         2           ioctl
  0.00    0.000000           0         8         8 access
  0.00    0.000000           0         1           execve
  0.00    0.000000           0         2           getdents
  0.00    0.000000           0         2         2 statfs
  0.00    0.000000           0         1           arch_prctl
  0.00    0.000000           0         1           set_tid_address
  0.00    0.000000           0         9           openat
  0.00    0.000000           0         1           set_robust_list
  0.00    0.000000           0         1           prlimit64
------ ----------- ----------- --------- --------- ----------------
100.00    0.000142                   120        10 total
So you can see the summary gives you an idea about how many calls were made per syscall as well as time-related information for each syscall.
Conclusion
We've just scratched the surface here as the strace command offers a lot of other features as well. Once you're done practicing what we've discussed here, head to the strace man page to learn more about the tool.

