How To Monitor And Manage Apache Tomcat - Page 2
Adding Performance Counters For Apache Tomcat
Performance counters measure system activity and performance (metrics). The application retrieves their current values in predefined intervals. The aim of probing and collecting data is to analyze and convert the data into a performance graph/chart. You can define a counter manually or load it from a template. Counter templates provide defined probing parameters for specified devices in order to improve and quicken counter creation.
Each counter template is characterized by the following information:
- Name and description - unique identifier and optional description,
- Device type - type of a device,
- Protocol type - protocol used,
- Probing interval - pauses between probing.
In order to add Apache Tomcat performance counters, perform the following steps:
- Select device from aspect tree in Home view.
- Select Monitors tab and switch to the counter list by clicking Counter list link in the upper-right corner of the tab field. A counter list is displayed.
- Select Create counter from the global action menu and click Go.
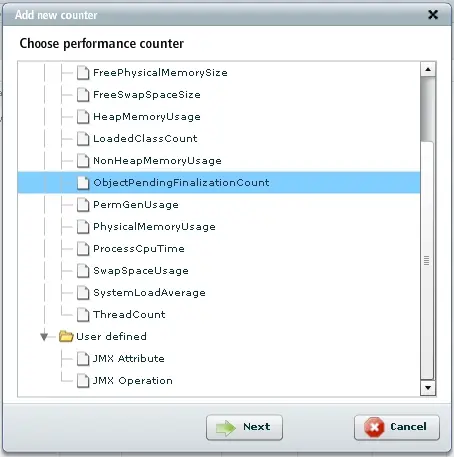
- Select the counter you want to create and click Next.
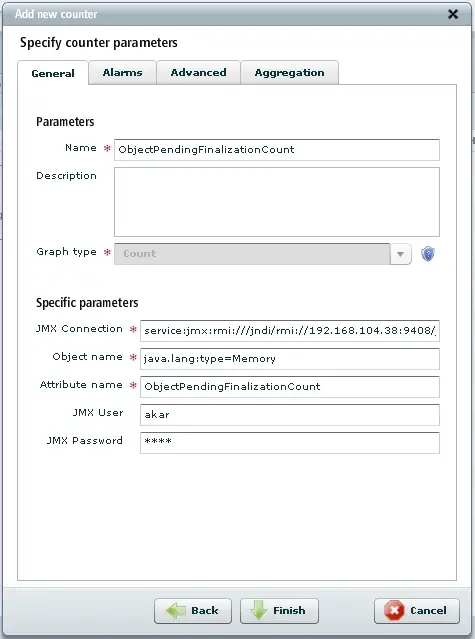
- Once the data has been loaded, the edit window shows up with all counter attributes to be provided.
- Specify the rest of counter parameters (alarms, thresholds etc.) and click Finish.
- The new counter has been created and is now visible on the counter list.
Creating Custom Event Processing Rules For Apache Tomcat
In this tutorial I'll show how to assign basic event processing rules, such as: alarm generating, event dropping/forwarding and severity assigning.
To assign an event processing rule, perform the following steps:
- After selecting the desired host go to Events tab.
- Select events, choose Assign processing rules and click Go.
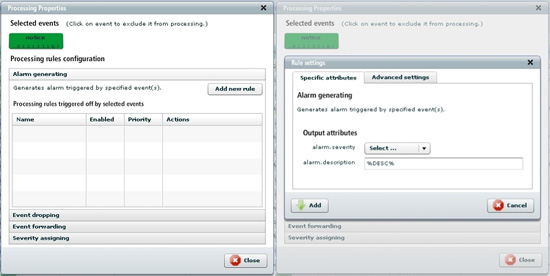
- A dialog window is displayed (see figure below).
- Select rule category and click Add new rule.
- The newly created event processing rule is now visible and active (there's no need to logout).
Tomcat Plugin Overview
Tomcat plugin provides four following views:
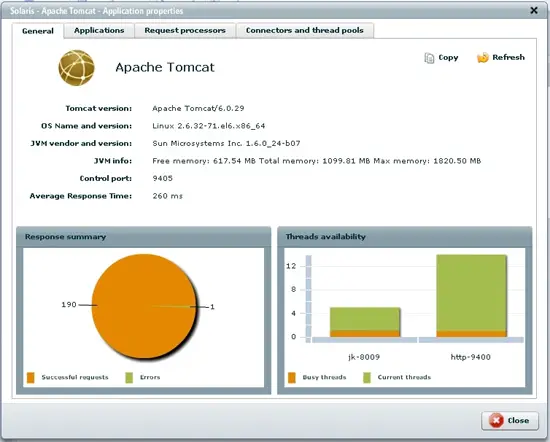
- General information view - overall information about Tomcat version, OS Name and version, JVM vendor and version, JVM info,Control port, Average Response Time. It also contains dashboard view with charts for response summary and threads availability).
- Applications view - information concerning applications status: current sessions, peak sessions as well as servlets and page performance: URL and average response time.)
- Request processors view - information concerning request processors and global request processor (URI, Worker, request and error counts, sent and received bytes, processing time) and chart for response summary for connector.)
- Connectors and thread pools view - information concerning connectors parameters (port, protocol, secure, redirect port, max post size), thread pool (name, current threads busy, current threads count, max spare threads) and chart for threads availability.)
If you performed all actions described in this guide you are now able to monitor Apache Tomcat application.


