How To Monitor And Manage Apache Tomcat
This guide provides an overview on how to monitor and manage Apache Tomcat application server. The guide is divided into following steps:
- Adding Apache Tomcat to the list of monitored applications.
- Configuring availability sensors and performance counters for Apache Tomcat.
- Tomcat plugin overview.
- Setting up alarms and notification policies.
Tools used in this guide:
- Apache Tomcat: http://tomcat.apache.org/
- Free monitoring tool (Verax NMS express): http://www.veraxsystems.com/en/products/nms
Adding Apache Tomcat To Device Inventory
In order to include Apache Tomcat to be monitored by Verax NMS, add an application instance to the device actually running this instance.
Note: The system allows for creating multiple instances for applications of the same type on a single device.
In order to add an Apache Tomcat to the device running its instance, perform the following steps:
- Log in into the Verax NMS and select Home from the mainmenu.
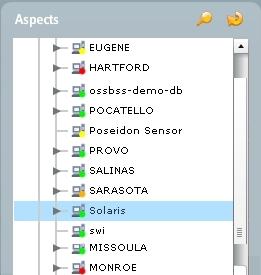
- Select a device running the Apache Tomcat instance from the left-side aspects view.
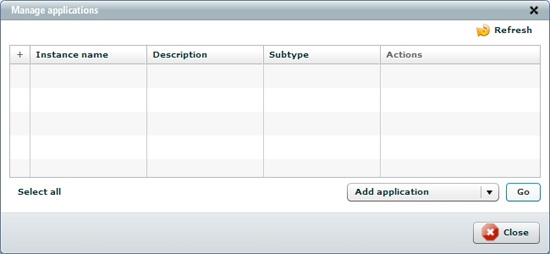
- In Summary tab select Manage applications from the actions section.
- A pop-up dialog is displayed.
- Select Add application option from the context menu and click Go. A dialog window is displayed.
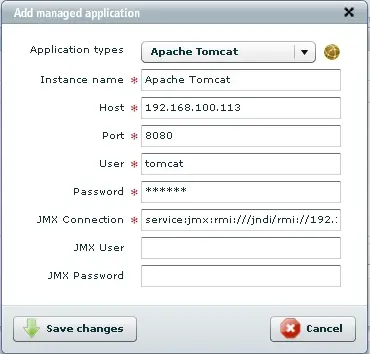
- Choose Apache Tomcat from Application types.
Systems will ask to enter the following application-specific parameters:
- Instance name - You can enter any name describing the monitored application instance.
- Host - In most cases, the host address is an IP address of the device the application instance is assigned to.
- Port - Port of application server.
- User - Username used to connect to Apache Tomcat.
- Password - Password used to connect to Apache Tomcat.
- JMX Connection - Set jmx connection url
- JMX User
- JMX Password
Note: application-specific parameters depend on the selected application type.
- Provide the necessary information and click Save changes.
- The system will ask if you want to add a default set of sensors and counters for Apache Tomcat. In this guide sensors and performance will be added manually, so click No.
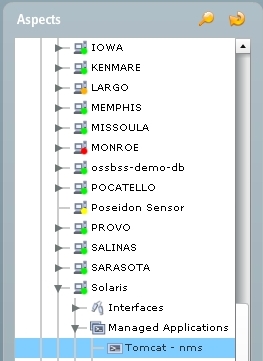
- The newly added Apache Tomcat is now visible in the aspect tree within the host’s node in Managed Applications category.
Apache Tomcat instance can be monitored by:
- Obtaining information and statistics on demand using Show advanced view action available on Summary tab which shows several views with major information about server as well as performance characteristics.
- Collecting performance data by configuring performance counter using JMX counter or predefined JMX-based counter templates.
- Checking application or service availability by configuring JMX-based sensor.
- Checking web application availability and measure user-experience by configuring HTTP sensor.
Adding Sensors For Apache Tomcat
Monitoring of Tomcat features in NMS uses the JMX protocol. This protocol should be properly configured on the Tomcat server side. This require the following Java parameters on server startup:
set CATALINA_OPTS=-Dcom.sun.management.jmxremote \
-Dcom.sun.management.jmxremote.port=%my.jmx.port% \
-Dcom.sun.management.jmxremote.ssl=false \
-Dcom.sun.management.jmxremote.authenticate=false
See the Tomcat documentation for details: http://tomcat.apache.org/tomcat-6.0-doc/monitoring.html
Sensors are active monitors periodically querying the device services for which they are configured and waiting for their responses. If a query is returned with an expected response, the queried service is considered "available." If a response is not received (timed out), or if the response is not as expected, the queried service is considered "unavailable".
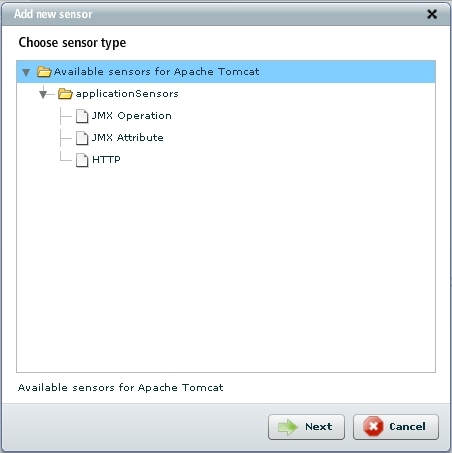
The following types of sensors for Apache Tomcat application type are available by default:
- JMX Operation - Checks if given operation invoked by device JMX service returns a result for given MBean.
- JMX Attribute - Checks if given attribute get by device JMX service returns a value for given MBean.
- HTTP - Checks if device HTTP service gives a response defined in parameter "Response code" for given HTTP/HTTPS address and if regular expression is given if response body contains a string matching the expression.
In order to add a sensor, perform the following steps:
- Select device from the aspect tree in Home view.
- Select Monitors tab and switch to sensor list by clicking Sensor list link in the upper-right corner of the tab field. The sensor list is displayed.
- Select Add from the global action menu and click Go. The wizard dialog is displayed.
- Select the sensor you want to add and click Next.
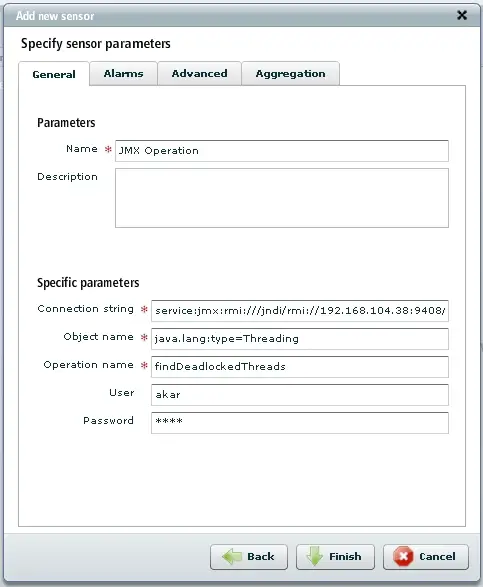
- A dialog shows up with all sensor parameters to be provided. Specify the sensor parameters and click Finish.
- Once the sensors have been added, they are visible on the sensor list (Monitors tab).

