How to Install Sysdig to Monitor System Load on Ubuntu 24.04
On this page
Sysdig is a powerful, open-source system analysis and troubleshooting tool for Linux that provides deep visibility into the behavior of running systems. It captures and inspects system calls and other kernel-level events, allowing users to gain real-time insights into system activity, processes, network traffic, file access, and more. Sysdig is often used for performance monitoring, security auditing, and debugging, as it can trace the entire activity of a system with fine-grained detail. It comes with a rich set of predefined filters and outputs, making it versatile for various use cases, including container monitoring, where it can analyze containerized applications. Sysdig's ability to record and replay system activity makes it especially valuable for post-incident analysis.
In this tutorial, I will show you how to install and use the Sysdig monitoring tool on Linux.
Prerequisites
- A server running Linux. I will use Ubuntu 24.04 here.
- A root password is configured on the server.
Install Sysdig
For Debian-based operating systems like Ubuntu and Debian, install the Sysdig with the following command:
apt install gnupg software-properties-common curl -y
curl -s https://s3.amazonaws.com/download.draios.com/stable/install-sysdig | bash
For RPM-based operating systems like AlmaLinux, Rocky Linux, CentOS, RHEL, and Fedora, install the Sysdig with the following command:
rpm --import https://s3.amazonaws.com/download.draios.com/DRAIOS-GPG-KEY.public
curl -s -o /etc/yum.repos.d/draios.repo https://s3.amazonaws.com/download.draios.com/stable/rpm/draios.repo
dnf install sysdig -y
After installing Sysdig, verify the installed version of Sysdig using the following command:
sysdig --version
You will get the following output:
sysdig version 1.61.10
Working with Sysdig
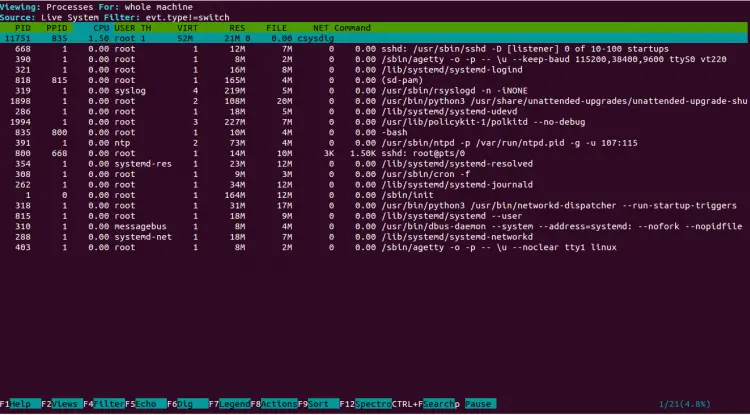
You can run the csysdig command to display the running processes, CPU usage, and memory usage:
csysdig
You should see the following screen:
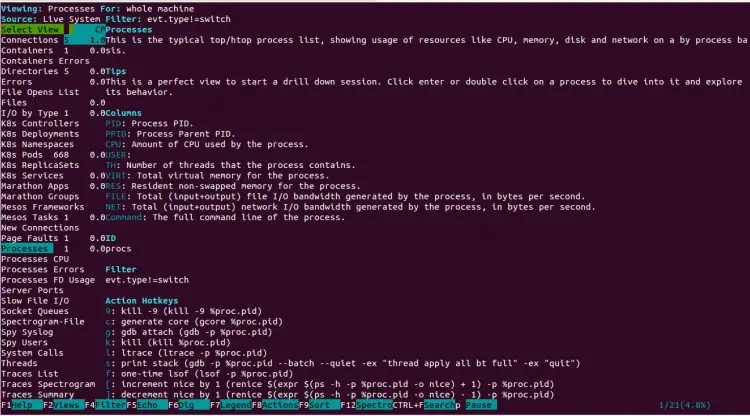
Now press F2 to open the other menu as shown below:
From here, you can arrow key to choose any things that you want to monitor in the left pane and hit Enter. For example, select the connections and hit Enter. You should see all incoming connections on the following screen:
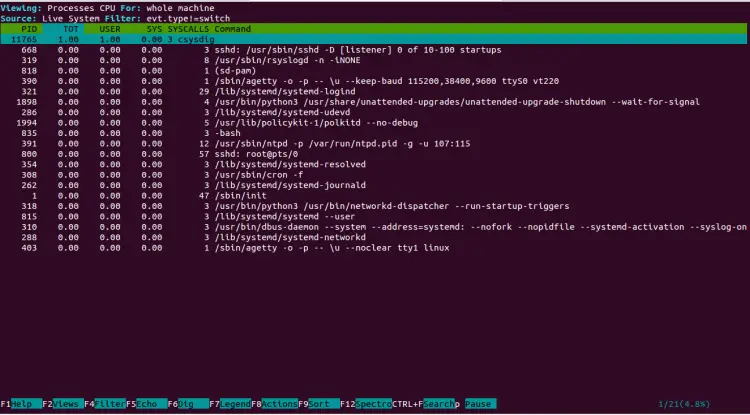
To view Processes and CPU information, select Processes CPU and hit Enter. You should see the following page:
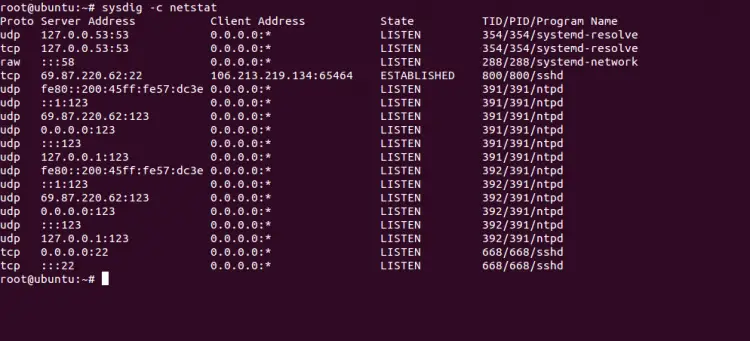
If you want to monitor all network connections directly from the command-line interface, run the following command:
sysdig -c netstat
You should see the following screen:
You can see the HTTP request log using the following command:
sysdig -c httplog
You should see all incoming HTTP requests in the following output:
2024-08-23 11:21:17.228051410 < method=GET url=69.87.220.62/ response_code=200 latency=1ms size=3138B
2024-08-23 11:21:23.139933688 < method=GET url=69.87.220.62/ response_code=200 latency=1ms size=3138B
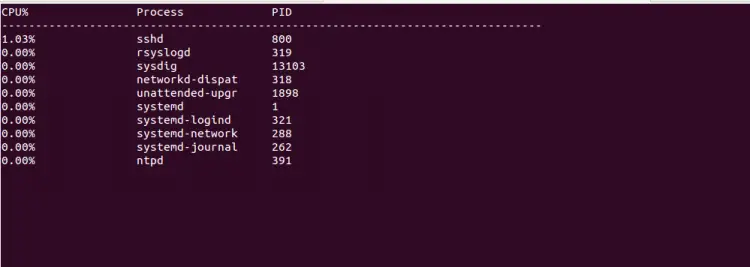
To monitor the process as per the CPU usage, run the following command:
sysdig -c topprocs_cpu
You should see the following screen:
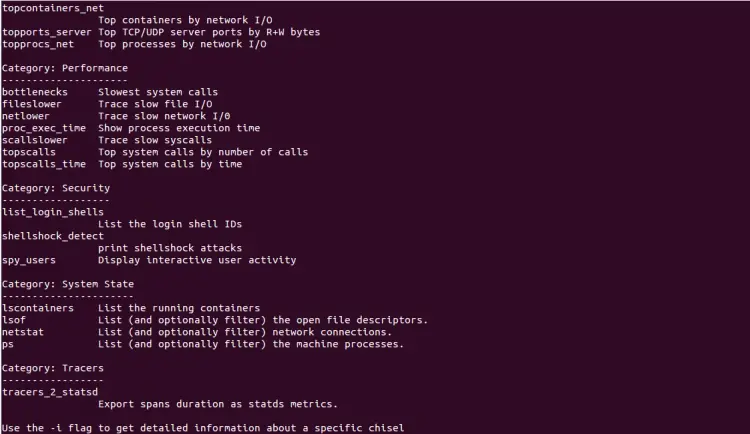
Run the following command to see all options available with sysdig command:
sysdig -cl
You should see the following screen:
You can use sysdig with spy_users to display interactive user activity.
sysdig -c spy_users
You should see the following output:
13133 11:38:03 root) free -m
13133 11:38:22 root) df -h
Conclusion
In the above guide, we explained how to install and use Sysdig to monitor system activity in real time. I hope this will help you troubleshoot system-related issues.

