How to Install Sysdig on Debian 11
Sysdig is an open-source, cross-platform system monitoring and troubleshooting tool. It's useful for experience sysadmins as well as those getting their first taste of the Linux command line. It can give us a ton of insight into what actually happens on our servers, containers, or desktops during normal operations.
Sysdig comes with a command-line interface, but it also has a web UI for those who are more GUI inclined.
Sysdig collects system data and lets the user filter and monitor this data in many ways. You can capture traffic to/from a container or VM, use filters to make the system only show you relevant events such as 'if process X is listening on port Y', and you can aggregate events together into graphical representations of long-term trends.
Sysdig's greatest strength is its depth of insight. Sysdig can tell you where all your disk reads are happening, how many packets every container is sending/receiving, or if any of your web servers are down. It even goes the extra mile and backs up this information with relevant binary data (if recorded).
Most of our time as sysadmins is spent troubleshooting problems that are hard to reproduce or identify. The reason these problems are so hard to debug is that there isn't enough information to go on.
Sysdig can give us enough information to solve these problems. Once we have this information, our troubleshooting becomes so much easier - it often feels like having a superpower.
Sysdig works on most major distributions, including CentOS, Ubuntu, Debian, Fedora Core, Arch Linux, Gentoo, and even OSX. The installation is simple enough; it doesn't require compiling the source code (yay!), and there's even an official GitHub page that has installation instructions for every distribution that Sysdig officially supports.
For this article, we will install Sysdig on a Debian 11 server. The process is simple enough and doesn't require much in-depth knowledge about Linux to get started.
Prerequisites
In order to install sysdig, we need to have:
- An ssh connection to our remote server.
- Root or sudo access.
Updating the System
It's a good idea to update the system before we proceed. We can do this by running:
sudo apt-get update && sudo apt-get upgrade -y
Once the updates are done, run the following commands to install the required dependencies. libc6 is the C standard library used by Sysdig to do most of its heavy lifting. curl is a tool that retrieves files using the HTTP or HTTPS protocol, and it's what we will use to download sysdig. libcurl3 is a dependency for curl.
sudo apt install libc6 libcurl3 gnupg -y
sudo apt install software-properties-common curl -y
Installing Syndig on Debian 11
Now that the system is updated, let's download and install Sysdig. Run the following command to download and install sysdig.
sudo curl -s https://s3.amazonaws.com/download.draios.com/stable/install-sysdig | sudo bash
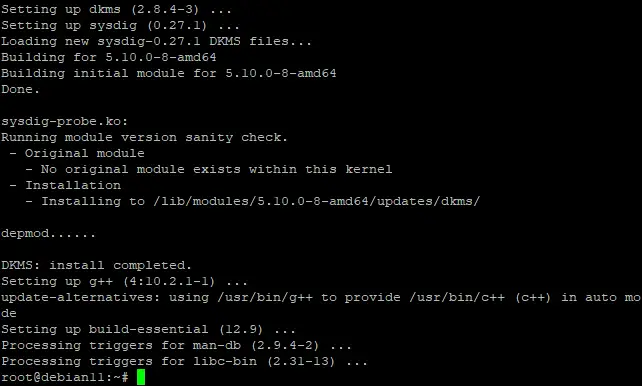
Depending on your server's specifications, this may take a while. So please be patient while this download and installation finished up.
Sample output:
Once the installation is complete, we can check if Sysdig is installed correctly by running the command below.
sysdig --version
If the installation were successful, this command will return sysdig version details as shown below.
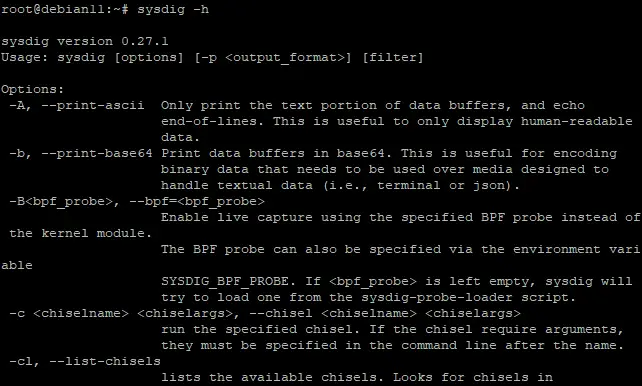
You can also check out sysdig's various capabilities by running the following command.
sysdig -h
Using Sysdig
Now that we have Sysdig installed, let's go over some of the basic commands in Sysdig.
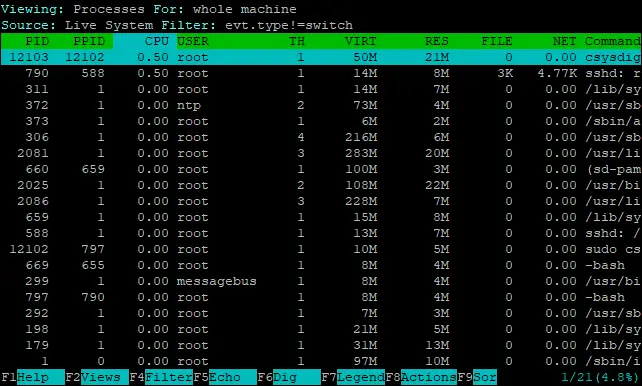
The first thing we need to do is run the command below to start capturing system activity. We use the sysdig command to monitor the system. We run the sysdig command with sudo prefix, which is required because csysdig requires root or sudo access in order to work.
sudo csysdig
Sample output:
As sysdig starts capturing events, sysdig will start to populate the interface with information. After running the above command, the system data refreshed every two seconds. This is controlled by the variable refresh_rate, which defaults to 2 seconds. This can be adjusted using sysdig's configuration file.
In the output above, you will see columns like PID, Name, CPU and Comm. These are column descriptions and can be seen by hovering your mouse over them. The syntax of column names is [field name]- [field descriptor].
The fields we care about most usually include:
- PID - the PID of the process which generated the event.
- PPID - the PID of the parent process for a given process.
- %CPU - how much CPU time a process is using.
- USER - the username of the user responsible for the process.
- RES - the amount of non-swapped memory a process is using.
- Command - the command line that started the process.
Of course, there are plenty of other columns you can use to dig deeper into system activity. And Sysdig can be customised to suit your needs.
As the system data continuously refreshes, it can be difficult to understand what's going on. We can stop sysdig from running by pressing CTRL + C. Once the interface is cleared, we can run a sysdig command with options and filters to get the data we want.
The systax is sysdig [options] [filters].
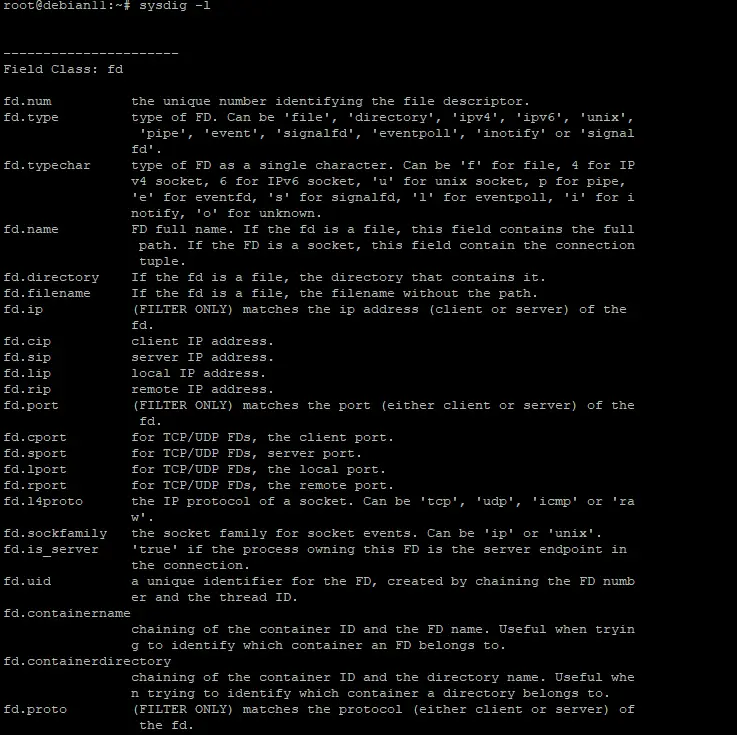
Sysdig’s filtering mechanism is very powerful and can be used to find exactly what you are looking for. Filters, similar to tcpdump, consist of a chain of one or more primitive expressions that are linked by conjunctions (‘and’, ‘or’) and optionally terminated by a disjunction (‘not’). To show all the filters we can use with sysdig, run the following command.
sysdig -l
You will get a list with a large number of filters with a brief description of each as shown below.
Since it's impossible to cover all of them, we'll cover some commonly used filters.
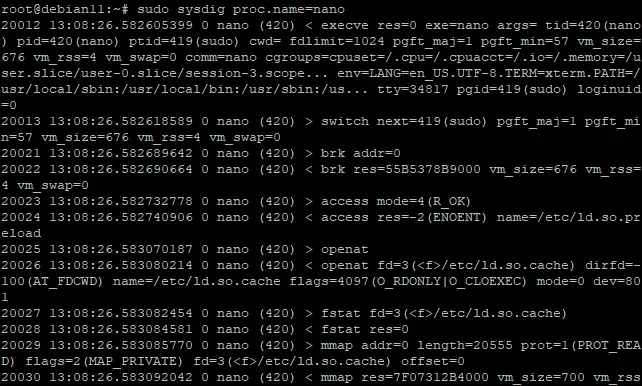
We will start with the filter - proc.name= which allows us to filter out for specific process names.
For example, to look for all the events for the process name "nano", we can run the following command.
sudo sysdig proc.name=nano
Sample output:
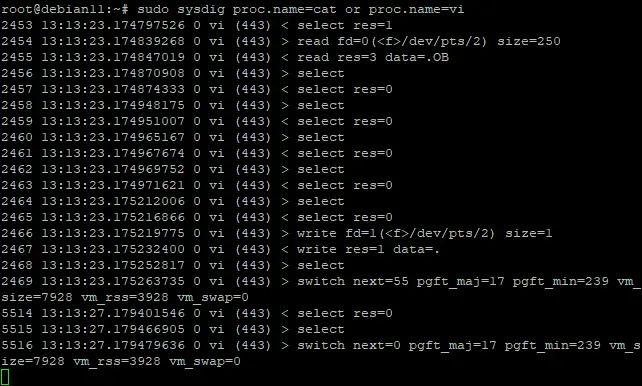
You can also use operators like “or” and “and” to get more specific data. For example, you can get all the events for either "nano" or "vi".
sudo sysdig proc.name=cat or proc.name=vi
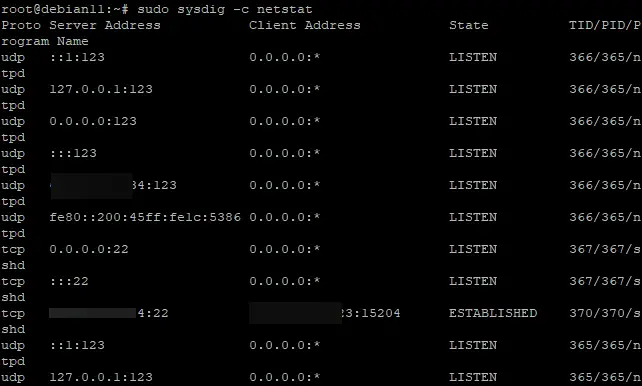
Run the command below to see the network-related events. You can see which ports are connected to, MAC addresses and many more in real-time.
sudo sysdig -c netstat
Sample output:
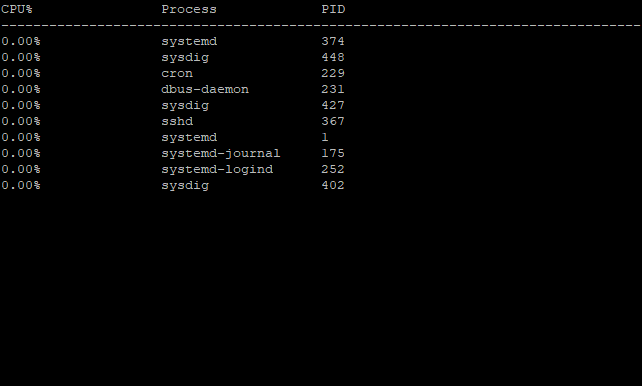
Run the command below to get the top CPU consuming processes.
sudo sysdig -c topprocs_cpu
Sample output:
In order to capture system activity and save it for later analysis, use the -w option, followed by a filename. In the example below, we capture all of the output from sysdig into a file named “sysdig-output.scap”
sudo sysdig -w sysdig-output.scap
This command tells sysdig to output the data continuously until it is stopped by pressing CTRL+C. With time, the file will grow large in size. You can use the -C option to capture the system activity to a file with a maximum size of a specified number of MB.
For example, the command below will create a new file every 1MB and store the system activity in it.
sudo sysdig -C 1 -w sysdig-output.scap
Run the ls -l command to see the newly created file with the name “sysdig-output.scap” as shown below.
ls -l
The output is as follows:
Conclusion
Sysdig has a large number of functionalities and can be used as a great tool for troubleshooting and performance analysis. And since it's open-source, you can also extend its functionality through chisels to meet your needs.
In this article, we have covered some of the basic commands to get started with sysdig. For further reading on sysdig and its use-cases, please see its documentation page.

