How to Install FileBeat on Ubuntu
The Elastic Stack is a combination of four main components Elasticsearch, Logstash, Kibana, and Beats. Filebeat is one of the most famous members of this family that collects, forward,s and centralizes event log data to either Elasticsearch or Logstash for indexing. Filebeat has many modules, including Apache, Nginx, System, MySQL, auditd, and many more, that simplify the visualization of common log formats down to a single command.
In this tutorial, we will show you how to install and configure Filebeat to forward event logs, SSH authentication events to Logstash on Ubuntu 18.04.
Prerequisites
- A server running Ubuntu 18.04 with Elasticsearch, Kibana and Logstash installed and configured.
- A root password is configured on your server.
Getting Started
Before starting, update your system with the latest version. You can do it by running the following command:
apt-get update -y
apt-get upgrade -y
Once your system is updated, restart it to apply the changes.
Install Filebeat
By default, the Filebeat is not available in the Ubuntu 18.04 default repository. So you will need to add the Elastic Stack 7 APT repository in your system.
First, install required package with the following command:
apt-get install apt-transport-https -y
Next, download and add the Elastic Stack key with the following command:
wget -qO - https://artifacts.elastic.co/GPG-KEY-elasticsearch | apt-key add -
Next, add the Elastic Stack 7 Apt repository with the following command:
echo "deb https://artifacts.elastic.co/packages/7.x/apt stable main" | tee /etc/apt/sources.list.d/elastic-7.x.list
Next, update the repository and install Filebeat with the following command:
apt-get update -y
apt-get install filebeat -y
Once the installation has been completed, you can proceed to the next step.
Configure Filebeat
By default, the Filebeat is configured to sent event data to Elasticsearc. Here, we will configure Filebeat to send event data to Logstash. You can do it by editing the file /etc/filebeat/filebeat.yml:
nano /etc/filebeat/filebeat.yml
Comment out elasticsearch output and uncomment Logstash output as shown below:
#-------------------------- Elasticsearch output ------------------------------

# output.elasticsearch:
  # Array of hosts to connect to.
  # hosts: ["localhost:9200"]

#----------------------------- Logstash output --------------------------------

output.logstash:
  # The Logstash hosts
  hosts: ["localhost:5044"]
Once you are finished, you can proceed to the next step.
Enable Filebeat System Module
By default, Filebeat comes with lots of modules. You can list out all the modules with the following command:
filebeat modules list
You should see the following output:
Enabled:

Disabled:
apache
auditd
aws
cef
cisco
coredns
elasticsearch
envoyproxy
googlecloud
haproxy
ibmmq
icinga
iis
iptables
kafka
kibana
logstash
mongodb
mssql
mysql
nats
netflow
nginx
osquery
panw
postgresql
rabbitmq
redis
santa
suricata
system
traefik
zeek
By default, all modules are disabled. So, you will need to enable the system module to collects and parses logs created by the system logging service. You can enable the system module with the following command:
filebeat modules enable system
Next, you can verify the system module with the following command:
filebeat modules list
You should see that the system module is now enabled:
Enabled:
system
Next, you will need to configure the system module to read-only authentication logs. You can do it by editing the file /etc/filebeat/modules.d/system.yml:
nano /etc/filebeat/modules.d/system.yml
Change the following lines:
- module: system
  # Syslog
  syslog:
    enabled: false
...
  # Authorization logs
  auth:
    enabled: true

    # Set custom paths for the log files. If left empty,
    # Filebeat will choose the paths depending on your OS.
    var.paths: ["/var/log/auth.log"]
Save and close the file when you are finished.
Load the index template in Elasticsearch
Next, you will need to load the template into Elasticsearch manually. You can do it with the following command:
filebeat setup --index-management -E output.logstash.enabled=false -E 'output.elasticsearch.hosts=["localhost:9200"]'
You should see the following output:
Index setup finished.
Next, generate the index template and install the template on Elastic Stack server with the following command:
filebeat export template > filebeat.template.json
curl -XPUT -H 'Content-Type: application/json' http://localhost:9200/_template/filebeat-7.0.1 [email protected]
Finally, start Filebeat service and enable it to start after system reboot with the following command:
systemctl start filebeat
systemctl enable filebeat
You can check the status of Filebeat with the following command:
systemctl status filebeat
You should see the following output:
? filebeat.service - Filebeat sends log files to Logstash or directly to Elasticsearch.
   Loaded: loaded (/lib/systemd/system/filebeat.service; disabled; vendor preset: enabled)
   Active: active (running) since Tue 2019-11-26 06:45:18 UTC; 14s ago
     Docs: https://www.elastic.co/products/beats/filebeat
 Main PID: 13059 (filebeat)
    Tasks: 28 (limit: 463975)
   CGroup: /system.slice/filebeat.service
           ??13059 /usr/share/filebeat/bin/filebeat -e -c /etc/filebeat/filebeat.yml -path.home /usr/share/filebeat -path.config /etc/filebeat

Nov 26 06:45:18 ubuntu filebeat[13059]: 2019-11-26T06:45:18.528Z        INFO        log/harvester.go:251        Harvester started for file: /va
Nov 26 06:45:18 ubuntu filebeat[13059]: 2019-11-26T06:45:18.528Z        INFO        log/harvester.go:251        Harvester started for file: /va
Nov 26 06:45:18 ubuntu filebeat[13059]: 2019-11-26T06:45:18.529Z        INFO        log/harvester.go:251        Harvester started for file: /va
Nov 26 06:45:18 ubuntu filebeat[13059]: 2019-11-26T06:45:18.529Z        INFO        log/harvester.go:251        Harvester started for file: /va
Nov 26 06:45:18 ubuntu filebeat[13059]: 2019-11-26T06:45:18.530Z        INFO        log/harvester.go:251        Harvester started for file: /va
Nov 26 06:45:18 ubuntu filebeat[13059]: 2019-11-26T06:45:18.530Z        INFO        log/harvester.go:251        Harvester started for file: /va
Nov 26 06:45:21 ubuntu filebeat[13059]: 2019-11-26T06:45:21.485Z        INFO        add_cloud_metadata/add_cloud_metadata.go:87        add_clou
Nov 26 06:45:21 ubuntu filebeat[13059]: 2019-11-26T06:45:21.486Z        INFO        log/harvester.go:251        Harvester started for file: /va
Nov 26 06:45:22 ubuntu filebeat[13059]: 2019-11-26T06:45:22.485Z        INFO        pipeline/output.go:95        Connecting to backoff(async(tc
Nov 26 06:45:22 ubuntu filebeat[13059]: 2019-11-26T06:45:22.487Z        INFO        pipeline/output.go:105        Connection to backoff(async(t
Test Elasticsearch Data Reception
Now, verify whether the Elasticsearch is receiving data or not with the following command:
curl -X GET localhost:9200/_cat/indices?v
You should see the following output:
health status index                            uuid                   pri rep docs.count docs.deleted store.size pri.store.size
green  open   .kibana_task_manager_1           fpHT_GhXT3i_w_0Ob1bmrA   1   0          2            0     46.1kb         46.1kb
yellow open   ssh_auth-2019.11                 mtyIxhUFTp65WqVoriFvGA   1   1      15154            0      5.7mb          5.7mb
yellow open   filebeat-7.4.2-2019.11.26-000001 MXSpQH4MSZywzA5cEMk0ww   1   1          0            0       283b           283b
green  open   .apm-agent-configuration         Ft_kn1XXR16twRhcZE4xdQ   1   0          0            0       283b           283b
green  open   .kibana_1                        79FslznfTw6LfTLc60vAqA   1   0          8            0     31.9kb         31.9kb
You can also verify ssh_auth-2019.05 index with the following command:
curl -X GET localhost:9200/ssh_auth-*/_search?pretty
You should see the following output:
{
  "took" : 1,
  "timed_out" : false,
  "_shards" : {
    "total" : 1,
    "successful" : 1,
    "skipped" : 0,
    "failed" : 0
  },
  "hits" : {
    "total" : {
      "value" : 10000,
      "relation" : "gte"
    },
    "max_score" : 1.0,
    "hits" : [
      {
        "_index" : "ssh_auth-2019.11",
        "_type" : "_doc",
        "_id" : "g7OXpm4Bi50dVWRYAyK4",
        "_score" : 1.0,
        "_source" : {
          "log" : {
            "offset" : 479086,
            "file" : {
              "path" : "/var/log/elasticsearch/gc.log"
            }
          },
          "event" : {
            "timezone" : "+00:00",
            "dataset" : "elasticsearch.server",
            "module" : "elasticsearch"
          },
Add Index on Kibana
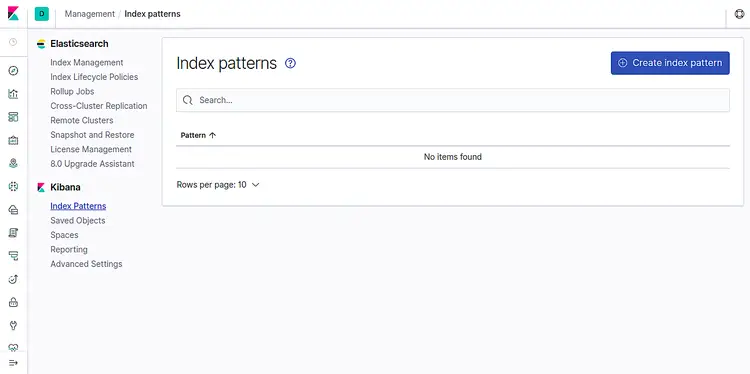
Now, login to your Kibana dashboard and click on Index Patterns. You should see the following page:
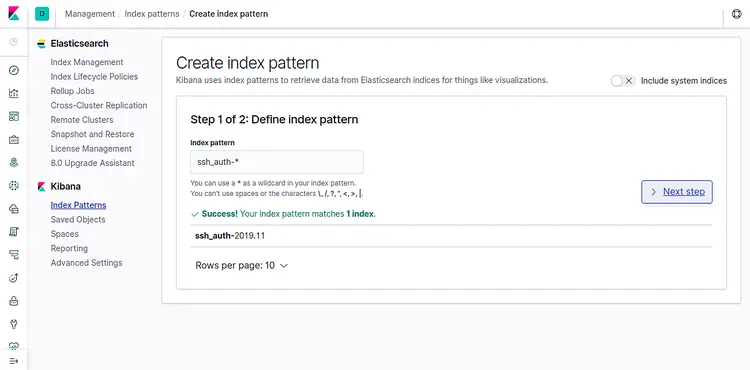
Now, click on the Create index pattern. You should see the following page:
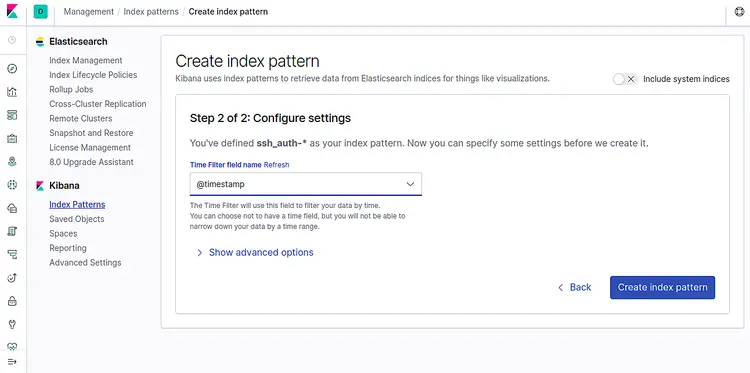
Add ssh_auth-* index and click on the Next step button. You should see the following page:
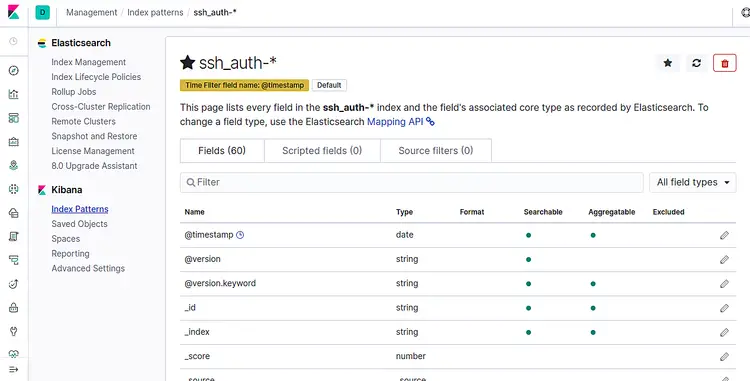
Now, select @timestamp and click on the Create index pattern button. You should see the following page:
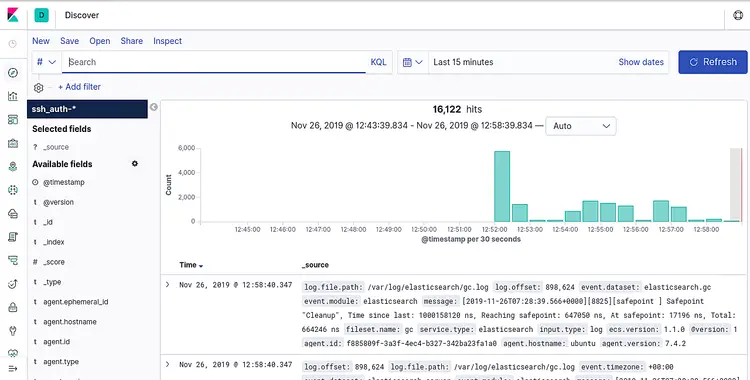
Now, click on the Discover tab on the left pane. You should be able to see your data in the following screen:
Congratulations! You have successfully installed and configured Filebeat to send event data to Logstash. You can now proceed to create Kibana dashboards after receiving all the data.

