How to Install and Configure Monit on Debian 11
Monit is a free and open-source monitoring tool that monitors server processes and services like Apache, Nginx, Rsyslog, FTP, and SSH on Linux systems. Monit provides a web-based interface as well as a command-line client to monitor the different services. It has the ability to start a process automatically when it is not running. It also allows you to monitor remote machines' TCP port, server protocol, and ping.
This tutorial will explain how to install and use the Monit monitoring tool on Debian 11.
Prerequisites
- A server running Debian 11.
- A root password is configured on your server.
Install Monit on Debian 11
By default, the Monit package is available in the Debian 11 default repository. You can install it by running the following command:
apt-get install monit -y
Once the installation has been completed, you can start the Monit service and enable it to start at system reboot using the following command:
systemctl start monit
systemctl enable monit
You can also check the status of the Monit using the following command:
systemctl status monit
You will get the following output:
? monit.service - LSB: service and resource monitoring daemon
     Loaded: loaded (/etc/init.d/monit; generated)
     Active: active (running) since Sat 2022-01-01 07:38:44 UTC; 10s ago
       Docs: man:systemd-sysv-generator(8)
    Process: 1005 ExecStart=/etc/init.d/monit start (code=exited, status=0/SUCCESS)
      Tasks: 1 (limit: 2341)
     Memory: 1.7M
        CPU: 20ms
     CGroup: /system.slice/monit.service
             ??1010 /usr/bin/monit -c /etc/monit/monitrc

Jan 01 07:38:44 debian11 systemd[1]: Starting LSB: service and resource monitoring daemon...
Jan 01 07:38:44 debian11 monit[1005]: Starting daemon monitor: monit.
Jan 01 07:38:44 debian11 systemd[1]: Started LSB: service and resource monitoring daemon.
Once you are finished, you can proceed to the next step.
Enable Monit Web UI
Monit also provides a web UI to manage and monitor different services. By default, it is disabled. So you will need to enable it and set an admin password. You can do it by editing the Monit configuration file:
nano /etc/monit/monitrc
Uncomment and change the following lines:
set httpd port 2812 and
allow admin:monitpassword
Save and close the file then restart the Monit service to apply the changes:
systemctl restart monit
By default, Monit listens on port 2812. You can check it using the following command:
ss -antpl | grep :2812
You will get the following output:
LISTEN 0      1024         0.0.0.0:2812      0.0.0.0:*    users:(("monit",pid=1322,fd=6))
LISTEN 0      1024            [::]:2812         [::]:*    users:(("monit",pid=1322,fd=7))
Configure Monit for Nginx
Monit allows you to monitor different services. First, check the status of your operating system using the following command:
monit status
You will get the following output:
Monit 5.27.2 uptime: 0m

System 'debian11'
  status                       OK
  monitoring status            Monitored
  monitoring mode              active
  on reboot                    start
  load average                 [0.14] [0.06] [0.02]
  cpu                          0.0%usr 0.0%sys 0.0%nice 0.0%iowait 0.0%hardirq 0.0%softirq 0.0%steal 0.0%guest 0.0%guestnice
  memory usage                 192.2 MB [9.7%]
  swap usage                   0 B [0.0%]
  uptime                       2m
  boot time                    Sat, 01 Jan 2022 07:37:55
  filedescriptors              512 [0.0% of 9223372036854775807 limit]
  data collected               Sat, 01 Jan 2022 07:39:34
By default, Monit provides an Nginx service configuration file but it is disabled by default. So you will need to enable it in order to monitor it. You can enable it by running the following command:
ln -s /etc/monit/conf-available/nginx /etc/monit/conf-enabled/
Next, restart the Monit service to apply the changes:
systemctl restart monit
Configure Monit for ProFTPD
Monit does not provide a service configuration file for ProFTPD. So you will need to create a ProFTPD service configuration file. You can create it with the following command:
nano /etc/monit/conf-available/proftpd
Add the following lines:
check process proftpd with pidfile /var/run/proftpd.pid
   start program = "/etc/init.d/proftpd start"
   stop  program = "/etc/init.d/proftpd stop"
if failed port 21 protocol ftp then restart
Save and close the file then enable the ProFTPD service configuration file using the following command:
ln -s /etc/monit/conf-available/proftpd /etc/monit/conf-enabled
Next, verify the syntax error in the configuration file using the following command:
monit -t
If everything is fine, you should see the following output:
Control file syntax OK
Finally, restart the Monit to apply the changes.
systemctl restart monit
Access Monit Web UI
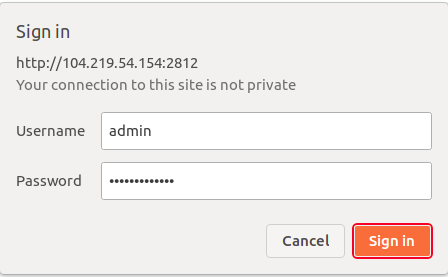
Now, open your web browser and access the Monit web interface using the URL http://your-server-ip:2812. You will be redirected to the Monit login page:
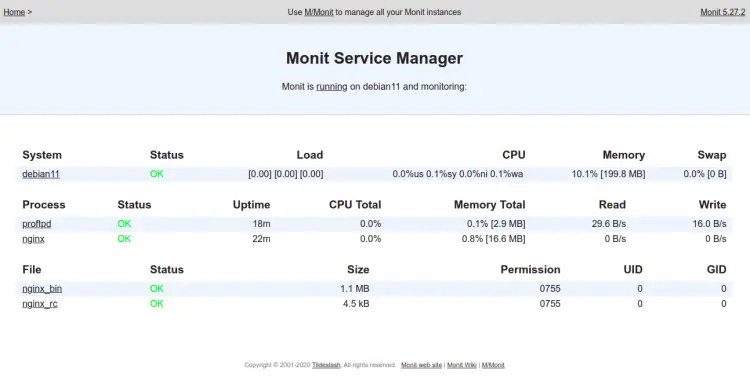
Provide your admin username, password and click on the Sign In button. You should see the Monit dashboard on the following screen:
Click on debian11 to check the status of your operating system. You should see the following screen:
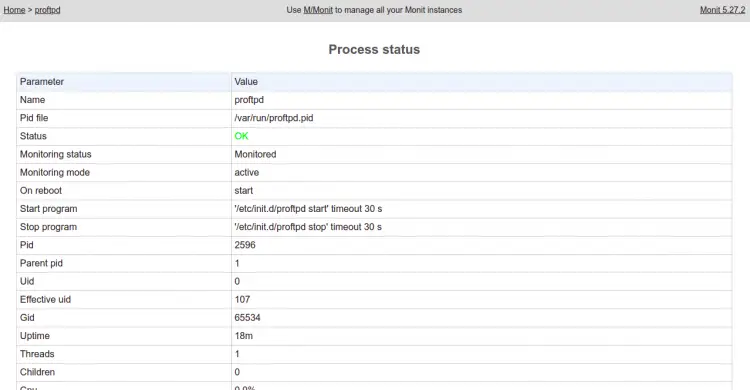
Click on the Nginx to check the status of the Nginx service. You should see the following screen:
Monitor Services via Command Line
You can also monitor the status of any services using the command line interface.
To get the summary of all services, run the following command:
monit summary
You will get the following output:
Monit 5.27.2 uptime: 0m
????????????????????????????????????????????????????????????????????????????????
? Service Name                    ? Status                     ? Type          ?
????????????????????????????????????????????????????????????????????????????????
? debian11                        ? OK                         ? System        ?
????????????????????????????????????????????????????????????????????????????????
? proftpd                         ? OK                         ? Process       ?
????????????????????????????????????????????????????????????????????????????????
? nginx                           ? OK                         ? Process       ?
????????????????????????????????????????????????????????????????????????????????
? nginx_bin                       ? OK                         ? File          ?
????????????????????????????????????????????????????????????????????????????????
? nginx_rc                        ? OK                         ? File          ?
????????????????????????????????????????????????????????????????????????????????
To check the status of all services, run the following command:
monit status
You will get the following output:
Monit 5.27.2 uptime: 0m

Process 'proftpd'
  status                       OK
  monitoring status            Monitored
  monitoring mode              active
  on reboot                    start
  pid                          2596
  parent pid                   1
  uid                          0
  effective uid                107
  gid                          65534
  uptime                       16m
  threads                      1
  children                     0
  cpu                          -
  cpu total                    -
  memory                       0.1% [2.9 MB]
  memory total                 0.1% [2.9 MB]
  security attribute           unconfined
  filedescriptors              5 [0.5% of 1024 limit]
  total filedescriptors        5
  read bytes                   0 B/s [32 B total]
  disk read bytes              0 B/s [0 B total]
  disk read operations         0.0 reads/s [34 reads total]
  write bytes                  0 B/s [178 B total]
  disk write bytes             0 B/s [4 kB total]
  disk write operations        0.0 writes/s [3 writes total]
  port response time           2.495 ms to localhost:21 type TCP/IP protocol FTP
  data collected               Sat, 01 Jan 2022 08:00:43

Process 'nginx'
  status                       OK
  monitoring status            Monitored
  monitoring mode              active
  on reboot                    start
  pid                          2078
  parent pid                   1
  uid                          0
  effective uid                0
  gid                          0
  uptime                       20m
  threads                      1
  children                     1
  cpu                          -
  cpu total                    -
  memory                       0.6% [11.5 MB]
  memory total                 0.8% [16.6 MB]
  security attribute           unconfined
  filedescriptors              9 [0.9% of 1024 limit]
  total filedescriptors        19
  read bytes                   0 B/s [62.0 kB total]
  disk read bytes              0 B/s [3.4 MB total]
  disk read operations         0.0 reads/s [73 reads total]
  write bytes                  0 B/s [81 B total]
  disk write bytes             0 B/s [4 kB total]
  disk write operations        0.0 writes/s [2 writes total]
  data collected               Sat, 01 Jan 2022 08:00:43

File 'nginx_bin'
  status                       OK
  monitoring status            Monitored
  monitoring mode              active
  on reboot                    start
  permission                   755
  uid                          0
  gid                          0
  size                         1.1 MB
  access timestamp             Sat, 01 Jan 2022 07:39:44
  change timestamp             Sat, 01 Jan 2022 07:39:47
  modify timestamp             Sat, 29 May 2021 14:21:37
  checksum                     12a1c0be9962768c055158782d1d564a (MD5)
  data collected               Sat, 01 Jan 2022 08:00:43

File 'nginx_rc'
  status                       OK
  monitoring status            Monitored
  monitoring mode              active
  on reboot                    start
  permission                   755
  uid                          0
  gid                          0
  size                         4.5 kB
  access timestamp             Sat, 01 Jan 2022 07:39:44
  change timestamp             Sat, 01 Jan 2022 07:39:47
  modify timestamp             Sat, 29 May 2021 14:21:37
  checksum                     290f6f12a12bc8e882bc5af46c1bfe7c (MD5)
  data collected               Sat, 01 Jan 2022 08:00:43

System 'debian11'
  status                       OK
  monitoring status            Monitored
  monitoring mode              active
  on reboot                    start
  load average                 [0.00] [0.00] [0.00]
  cpu                          0.0%usr 0.0%sys 0.0%nice 0.0%iowait 0.0%hardirq 0.0%softirq 0.0%steal 0.0%guest 0.0%guestnice
  memory usage                 199.5 MB [10.1%]
  swap usage                   0 B [0.0%]
  uptime                       23m
  boot time                    Sat, 01 Jan 2022 07:37:55
  filedescriptors              640 [0.0% of 9223372036854775807 limit]
  data collected               Sat, 01 Jan 2022 08:00:43
To check the status of the ProFTPD service, run the following command:
monit status proftpd
You will get the following output:
Monit 5.27.2 uptime: 0m

Process 'proftpd'
  status                       OK
  monitoring status            Monitored
  monitoring mode              active
  on reboot                    start
  pid                          2596
  parent pid                   1
  uid                          0
  effective uid                107
  gid                          65534
  uptime                       16m
  threads                      1
  children                     0
  cpu                          -
  cpu total                    -
  memory                       0.1% [2.9 MB]
  memory total                 0.1% [2.9 MB]
  security attribute           unconfined
  filedescriptors              5 [0.5% of 1024 limit]
  total filedescriptors        5
  read bytes                   0 B/s [32 B total]
  disk read bytes              0 B/s [0 B total]
  disk read operations         0.0 reads/s [34 reads total]
  write bytes                  0 B/s [178 B total]
  disk write bytes             0 B/s [4 kB total]
  disk write operations        0.0 writes/s [3 writes total]
  port response time           2.495 ms to localhost:21 type TCP/IP protocol FTP
  data collected               Sat, 01 Jan 2022 08:00:43
Conclusion
Congratulations! you have successfully installed Monit on Debian 11. You can now start adding remote hosts and monitor them from the web browser. Feel free to ask me if you have any questions.


