How to create Cloudwatch alarms for a DynamoDB Table on AWS
To monitor DynamoDB tables, metric data is sent to CloudWatch automatically. Following are the metrics aggregated at one-minute intervals for DynamoDB tables.
- ConditionalCheckFailedRequests: This returns the number of failed attempts to perform conditional writes.
- ConsumedReadCapacityUnits: This returns the number of read capacity units consumed to track how much of provisioned throughput is used over the specified time period.
- ConsumedWriteCapacityUnits: This is the number of write capacity units consumed to track how much of provisioned throughput is used over the specified time period.
- ReadThrottleEvents: This gives the number of requests to DynamoDB that exceed the provisioned read capacity units for a table.
- ReturnedBytes: This returns the number of bytes returned by GetRecords operations during the specified time period.
- ReturnedItemCount: This returns the number of items during the specified time period returned by Query, Scan or ExecuteStatement operations.
- ReturnedRecordsCount: This is the number of stream records during the specified time period returned by GetRecords operations.
- SuccessfulRequestLatency: This gives the successful requests to Amazon DynamoDB Streams or DynamoDB during the specified time period.
- SystemErrors: This gives the count of requests to Amazon DynamoDB Streams or DynamoDB during the specified time period that generates an HTTP 500 status code.
- TimeToLiveDeletedItemCount: This gives the number of items deleted by Time to Live during the specified time period to help you monitor the rate of Time to Live deletions on your table.
- ThrottledRequests: This gives the count of requests to DynamoDB that exceed the provisioned throughput limits.
- TransactionConflict: This returns the count of rejected item-level requests due to transactional conflicts.
- UserErrors: This gives the count of requests to Amazon DynamoDB Streams or DynamoDB during the specified time period that generates an HTTP 400 status code.
- WriteThrottleEvents: This gives the count of requests to DynamoDB that exceed the provisioned write capacity units for a table.
There are other metrics with an aggregation granularity at five minutes. To know more about metrics available for the DynamoDB table, visit the official documentation here.
In this article, we will create an alarm for a DynamoDB table to monitor "ConsumedWriteCapacityUnits" and send a notification to the SNS topic. Before we proceed, it is assumed that you are familiar with the DynamoDB table and SNS topics. Also, it is assumed that you have at least one DynamoDB table and an SNS topic.
Pre-requisites
- AWS Account (Create if you don’t have one).
- DynamoDB table (Click here to learn to create a DynamoDB table using Terraform).
- SNS Topic (Click here to learn to create an SNS Topic using Cloudformation)
What will we do?
- Login to AWS.
- Create an alarm for the existing DynamoDB table.
Login to AWS
Click here to go to AWS Login Page.
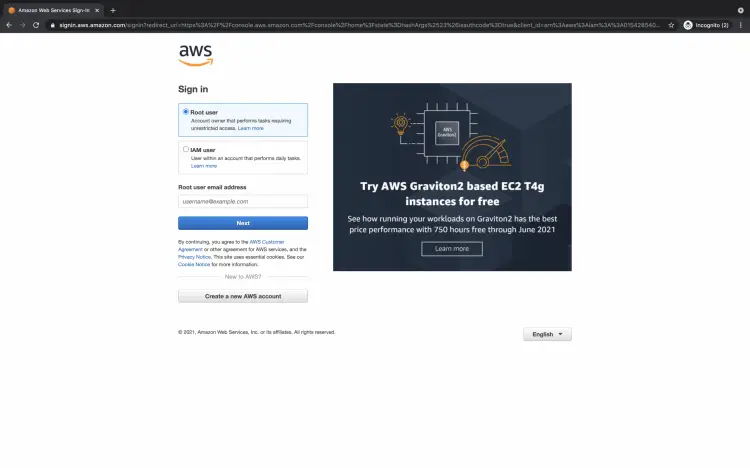
You will see the login page as follows when you hit the above link. Enter your credentials to login into your AWS account.
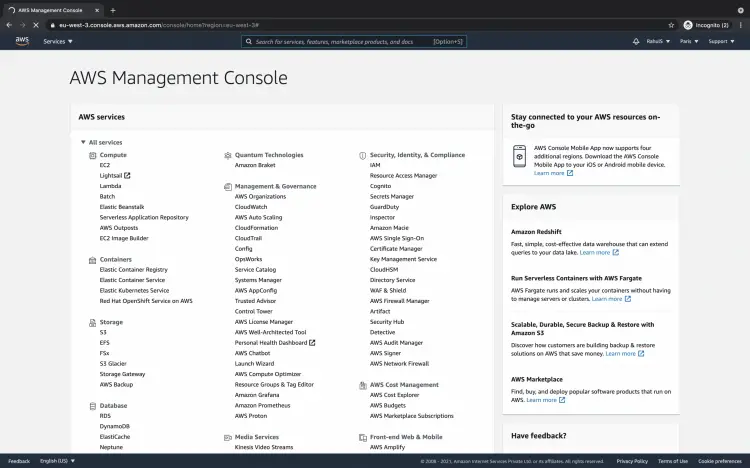
You will see the main AWS Management Console as follows once you successfully login into your account.
Create an alarm for the existing DynamoDB table.
Search for "Cloudwatch" in the search box at the top of the screen.
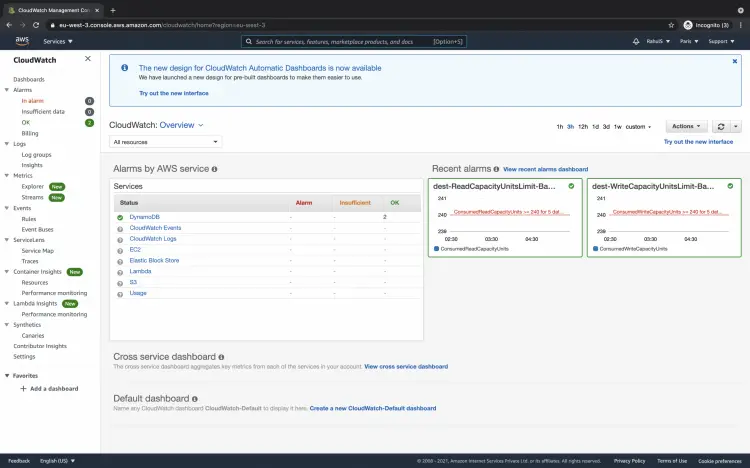
You will see the Cloudwatch dashboard as follows. Click on "Alarms" in the left panel.
You will see the existing alarms in your account on this screen. To create a new alarm for the existing DynamoDB table click on the "Create alarm" button.
You will get a screen to specify metrics and conditions for the alarm to be created. Click on the "Select metric" button.
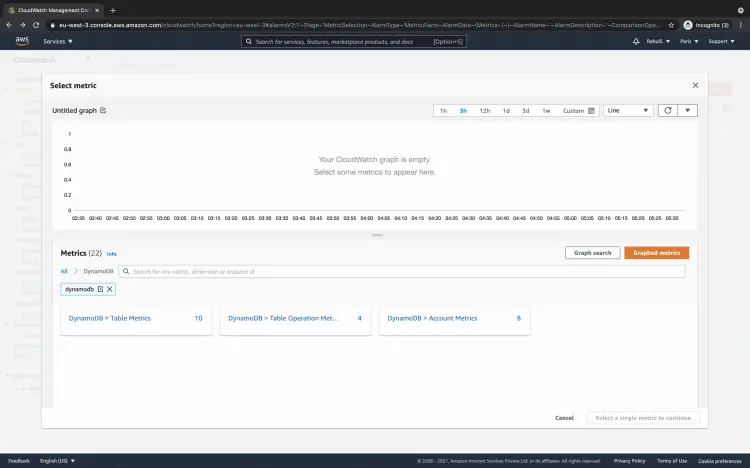
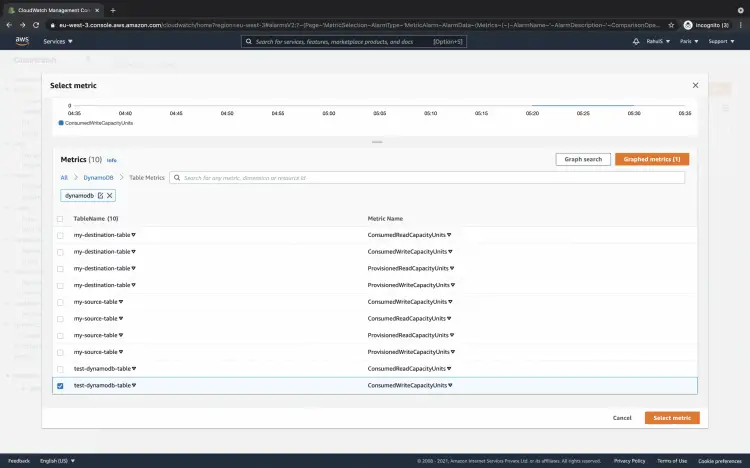
In the search box, search for "dynamodb" to filter the metrics. Click on "DynamoDB > Table Metrics" to see the available metrics for the existing DynamoDB tables.
Now you will see metrics available for the existing DynamoDB tables, you can choose any one of these to create an alarm. Here, I will proceed with "ConsumedWriteCapacityUnits". Click on the "Select metrics" button to proceed.
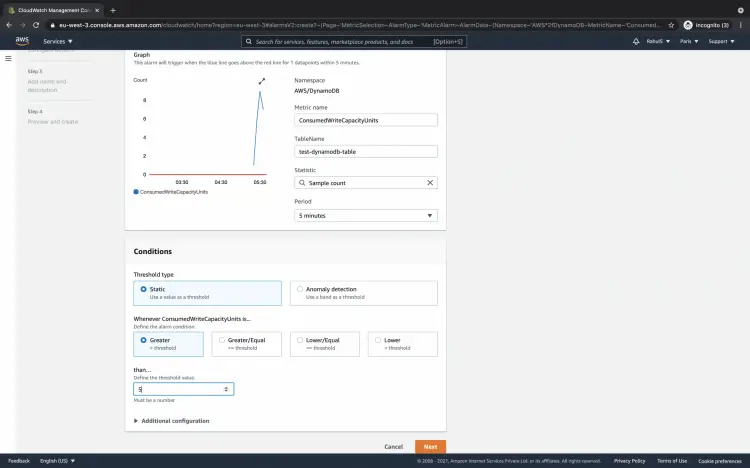
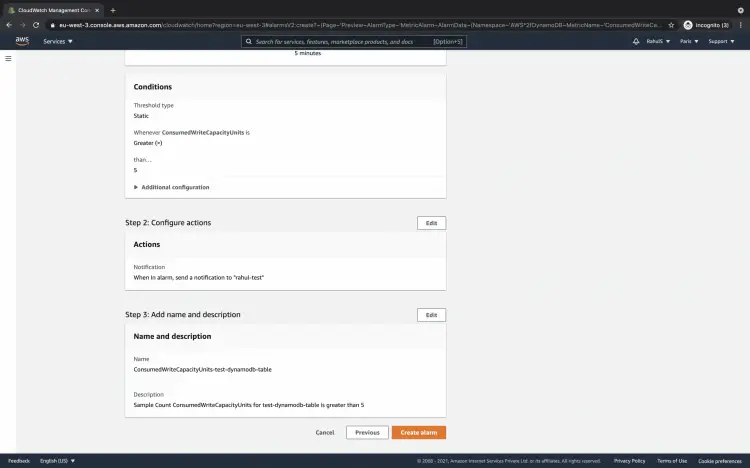
Choose the desired Statistics, Threshold type, alarm Condition, and Threshold value. Here, the alarm will be triggered if the Sample Count of the ConsumeWriteCapacityUnits is greater than 5 for 5 minutes.
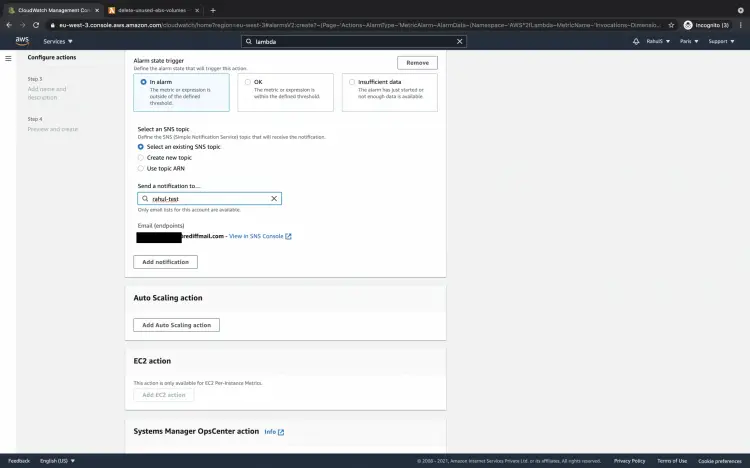
Choose the Alarm state trigger and the SNS topic. When the alarm is triggered it will move to "In alarm" state and send a notification to the specified SNS topic.
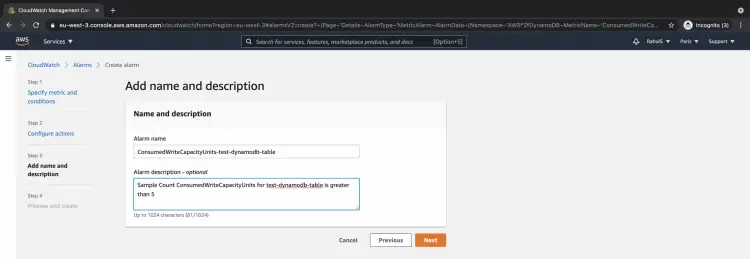
Add name and description to the alarm to be created and click on the "Next" button.
Review all the configurations before you create an alarm. Once the configurations look fine click on the "Create alarm" button.
Once the alarm is created you can see it under the "Alarms" console. Based on the threshold value and condition the state of the alarm will change. Since the condition has already been met, you can see that the alarm is in "In alarm" state.
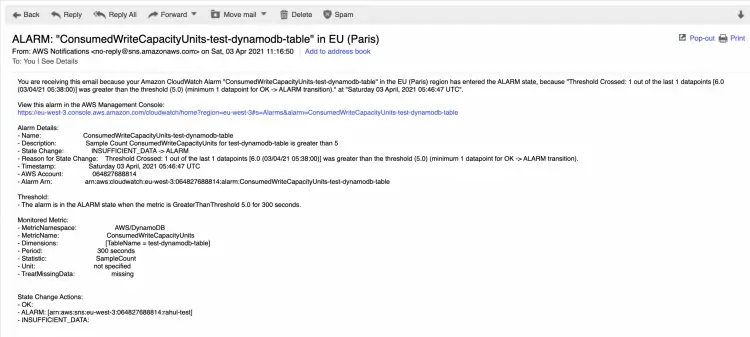
This has triggered the alarm and the notification has been sent to the subscription of the specified SNS topic.
Conclusion
In this article, we created an alarm for the metric "ConsumedWriteCapacityUnits". This alarm is triggered when "Sample Count" is "Greater" than threshold "5" for the period of "5 minutes". We also saw notification being sent to the SNS topic subscription when the alarm is triggered. You can now use the same steps and create alarms for different metrics, statistics, threshold type/value.

