On this page
How To Extract Values From top And Plot Them
By: Showayb Zahda+
Many researchers who are doing performance evaluation and benchmarking need to capture the values of the CPU and the RAM. Others might need to capture the throughput as well. In this short tutorial I will show how I capture the CPU and RAM values from “top” and then extract them in one line command.
In order to capture and store top output, use the batch mode “top -b”. Top by default updates its reading each 10 seconds. However, some researchers need the values each second. Well, it is easy just pass the parameter d, the command becomes “top -b -d 1”. 1 here is one second. This command will capture the top output each second. But it is not yet done. You need to store it. It is easy, just redirect the output to a file:
top -b -d 1 > top.txt
After you finish your experiment do not forget to stop top by pressing “ctrl + c”. Now you have the file which has a huge amount of lines and what you need from it is only part of a line. Fortunately, the format of the output is fixed and this makes extracting the values very easy.
The following is part of one of the seconds of top. Looking at the output you can see that there is a line starts with Cpu(s). and the line following it is Mem:. In fact we need part of these lines and not all. So how to do that.
top 18: 54:43 up 4:05, 2 users, load average: 3.64, 2.35, 1.37
Tasks: 135 total, 6 running, 129 sleeping, 0 stopped, 0 zombie
Cpu(s): 19.2%us, 19.7%sy, 0.0%ni, 61.1%id, 0.0%wa, 0.0%hi, 0.0%si, 0.0%st
Mem: 2054160k total, 2016144k used, 38016k free, 12292k buffers
Swap: 4417864k total, 38360k used, 4379504k free, 1310488k cached
PID USER PR NI VIRT RES SHR S %CPU %MEM TIME+ COMMAND
6929 shuaib 15 0 173m 12m 8940 R 65 0.6 7:22.44 gtkgnash
6916 shuaib 15 0 525m 58m 22m S 6 2.9 0:56.39 totem
5717 root 15 0 491m 87m 12m S 3 4.4 2:13.24 Xorg
If you are not familiar with Linux. things might look weird for you but anyway, just use the commands I will provide and get your job done. The commands I will be using are here, cat, grep cut, nl. I use them with pipelining so everything will be one line command. :)
cat top.txt | grep Cpu
This command will show something like the following:
Cpu(s): 14.3%us, 7.4%sy, 0.0%ni, 73.9%id, 0.0%wa, 0.0%hi, 4.4%si, 0.0%st
Cpu(s): 15.3%us, 7.4%sy, 0.0%ni, 72.4%id, 0.0%wa, 0.0%hi, 4.9%si, 0.0%st
Cpu(s): 11.7%us, 5.4%sy, 0.0%ni, 76.6%id, 2.9%wa, 0.5%hi, 2.9%si, 0.0%st
Cpu(s): 19.6%us, 9.3%sy, 0.0%ni, 66.7%id, 0.0%wa, 0.0%hi, 4.4%si, 0.0%st
Cpu(s): 14.8%us, 9.9%sy, 0.0%ni, 70.4%id, 0.0%wa, 0.5%hi, 4.4%si, 0.0%st
Cpu(s): 16.2%us, 9.3%sy, 0.0%ni, 67.2%id, 0.0%wa, 0.0%hi, 7.4%si, 0.0%st
Cpu(s): 12.3%us, 8.9%sy, 0.0%ni, 72.4%id, 0.0%wa, 0.0%hi, 6.4%si, 0.0%st
Cpu(s): 19.2%us, 11.8%sy, 0.0%ni, 63.1%id, 1.0%wa, 0.0%hi, 4.9%si, 0.0%st
Cpu(s): 16.2%us, 10.3%sy, 0.0%ni, 68.1%id, 0.0%wa, 0.5%hi, 4.9%si, 0.0%st
Cpu(s): 17.7%us, 9.9%sy, 0.0%ni, 68.5%id, 0.0%wa, 0.0%hi, 3.9%si, 0.0%st
Cpu(s): 15.7%us, 9.8%sy, 0.0%ni, 70.6%id, 0.0%wa, 0.0%hi, 3.9%si, 0.0%st
Cpu(s): 13.7%us, 7.4%sy, 0.0%ni, 74.0%id, 0.0%wa, 0.0%hi, 4.9%si, 0.0%st
Wooow this is magic. Well consider it if you like. Anyway as you can see each CPU line represents the reading of the CPU in one second. but let's say I need the idle value of this line which is for instance “68.1%id,”. Well, now comes the cutting turn. cut command cuts the data in a file or standard output based on the column number. The column number is the number of the character in a line. Everything counts one i.e. % is one, space is one, 5 is one column. So, how to count, you can use any text editor and read at the bottom of the editor the column number or you can do it manually.
Using the text editor I found that column 35 to 39 is the number that represents idle value. So how to cut it. We continue on our command:
cat top.txt | grep Cpu | cut -c 35-39
The output is below:
73.9
72.4
76.6
66.7
70.4
67.2
72.4
63.1
68.1
68.5
70.6
74.0
Woow another magic. It is fine. cut -c 35-39 means cut the columns 35 to 39 from the input and output them on the terminal. So, if you want to capture the %us part. Just count the columns and replace them. Remember that we captured the values each second. So, how to add the seconds, it is easy, use nl : number line:
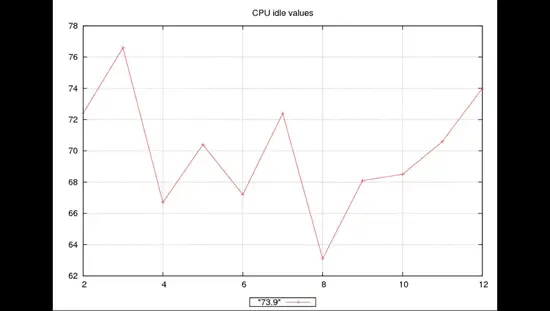
cat top.txt | grep Cpu | cut -c 35-39 | nl
1 73.9
2 72.4
3 76.6
4 66.7
5 70.4
6 67.2
7 72.4
8 63.1
9 68.1
10 68.5
11 70.6
12 74.0
Well, if you capture top each 3 seconds you can do this:
cat top.txt | grep Cpu | cut -c 35-39 | nl -i 3
1 73.9
4 72.4
7 76.6
10 66.7
13 70.4
16 67.2
19 72.4
22 63.1
25 68.1
28 68.5
31 70.6
34 74.0
Woow this is fantastic too. Now just redirect the output to a file:
cat top.txt | grep Cpu | cut -c 35-39 | nl > cpu.txt
Take the file to gnuplot or any other plotting software and enjoy.

For the Mem part. I guess it is your turn to do it following the same steps but changing the parameters.
Cheers
Showayb A A Zahda
[email protected]

