On this page
Monitoring VMware ESX/vSphere With Opsview
 Opsview offers a powerful, flexible way to monitor virtualized devices. In order to monitor VMware ESX and VM’s running on ESX, we will need to download and install a few items of software listed below, namely the VMware vSphere SDK for Perl and a Nagios plugin for checking ESX.
Firstly, we will need to get a terminal onto our Opsview server (via ssh, for example). Once on, “su –“ into root (if not already) and “cd /usr/local/src”.
Once on, we will need to download the VMware SDK (mentioned earlier) from the VMware website; link here. This will require you to have login access to www.vmware.com.
The file will be downloaded to the machine you are using to connect to your Opsview system, so we will need to either using ssh:// or WinSCP (depending on platform) to copy to the Opsview system. The file will resemble the following name:
VMware-vSphere-Perl-SDK-5.0.0-422456.x86_64.tar.gz
Once you have copied the file to /usr/local/src, as root we will need to install a few packages depending on your distribution:
Red Hat Enterprise Linux
yum install openssl-devel perl-Class-MethodMaker perl-SOAP-Lite perl-XML-LibXML openwsman-perl perl-Data-Dump
Opsview has built a separate package for perl-uuid which is available at the following links. Please install using 'rpm -iv <package>'
RHEL 6
x86: https://s3.amazonaws.com/perl-UUID/perl-UUID-0.04-1.0.el6.i686.rpm
x86-64: https://s3.amazonaws.com/perl-UUID/perl-UUID-0.04-1.0.el6.x86_64.rpm
RHEL 5
x86: https://s3.amazonaws.com/perl-UUID/perl-UUID-0.02-1.el5.i386.rpm
x86-64: https://s3.amazonaws.com/perl-UUID/perl-UUID-0.02-1.el5.x86_64.rpm
Ubuntu/Debian:
apt-get install cpanmin libdata-dump-perl libsoap-lite-perl libclass-methodmaker-perl libxml-libxml-simple-perl libssl-dev libarchive-zip-perl libuuid-perl
We will also need to run the following, due to idiosyncrasies within the VMware SDK:
export http_proxy=
export ftp_proxy=
Once installed, cd /usr/local/src and run the following commands:
tar zxvf VMware-vSphere-Perl-SDK-5.0.0-422456.x86_64.tar.gz
cd vmware-vsphere-cli-distrib/
./vmware-install.pl
Once you run the vmware-install.pl command, you will be asked to read and confirm you agree with the user agreement. Once done, the SDK will be installed.
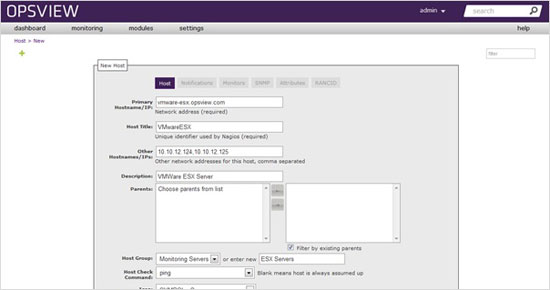
That is the sum of the command line portion of setting up Opsview to monitor VMware, Next we will add our VMware hosts via the GUI. To do this, login to Opsview and navigate to “SETTINGS > HOSTS” and click on the green ‘plus’ icon in the top left, to add a new host.
You will need to populate the fields accordingly, i.e. host address, description, etc as below:
The main part on this “HOST” section of adding a new host, is at the bottom – “Host Templates”. We have 2 host templates for VMware monitoring Opsview 4.1 onwards:
| OS – VMware ESX – Guest | Use this host template for your virtual machines running on the ESX server. |
| OS – VMware ESX – Host |
Use this host template for your ESX server itself, which is hosting virtual machines. |
Select the host template appropriate for your host, i.e. “OS – VMware ESX – Host” and click the arrow to move it into the left box, and finally click next.
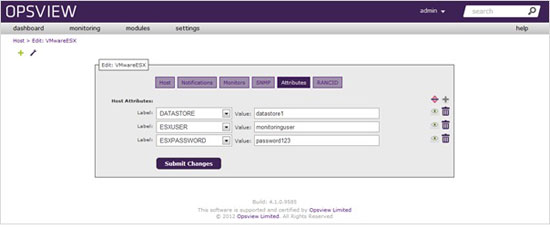
Next, you can optionally configure your notifications, or add extra monitors, but in order for monitoring to work we will need to navigate to “ATTRIBUTES” and specify the values for “ESXUSER”, “ESXPASSWORD” and “DATASTORE” (the name of the datastore we wish to monitor):
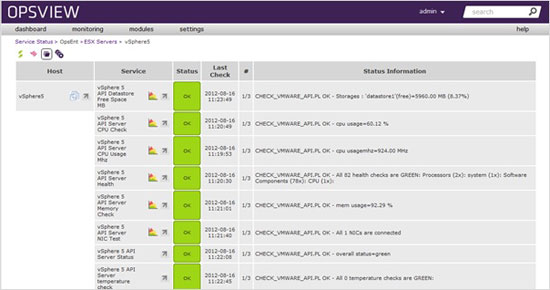
Click “SUBMIT CHANGES”, and our new VMware host is added. We must now go to “SETTINGS > APPLY CHANGES”, and reload configuration. After 8-10 seconds your Opsview will be reloaded and your new host is being monitored, as below:
You can also add, duplicate and customise the service checks via going to “SETTINGS > SERVICE CHECKS”, and modify/duplicate accordingly (i.e. if you want to monitor multiple datastores, etc).
Posted by: Brian King


