Monitoring Linux And Unix Server Temperatures With Opsview
Managing power consumption in a Datacenter is a key factor in helping keep overall business energy costs down and ensuring servers are running at optimum performance. Overheating can lead to increased costs for cooling and also runs the risk of servers crashing.
Opsview server monitoring software can be used to check and alert on server temperature and also the temperature of individual components within a server (Memory, CPU and Hard drives). Thresholds and alerts can be set for when critical temperatures are exceeded, helping to keep hot-running servers in check.
This blog post details how to configure Opsview to monitor the temperature of Linux and Unix servers.
Steps:
[NB: This guide assumes the system we wish to monitor already has the Opsview agent installed]
1. As root, we will need to install “lm_sensors” and “hddtemp” (names may differ by Linux distributions); on CentOS/RHEL they are acquired via “yum install lm_sensors hddtemp”.
2. Once these items are installed, we will need to run “sensors-detect” as root to detect the items we’d like to monitor the temperature of. Once completed, we will need to save this (simply hit ENTER) and the sensors-detect is complete.
3. Now lm_sensors and hddtemp are installed, we can test them locally as below:
HDD Temp:
[root@rhelserver ~]# hddtemp /dev/sda
/dev/sda: ST3120811AS: 31°C
lm_sensors:
[root@rhelserver ~]# sensors
coretemp-isa-0000
Adapter: ISA adapter
Core 0: +38.0°C (high = +84.0°C, crit = +100.0°C)
Core 1: +39.0°C (high = +84.0°C, crit = +100.0°C)
Core 2: +37.0°C (high = +84.0°C, crit = +100.0°C)
Core 3: +38.0°C (high = +84.0°C, crit = +100.0°C)
i5k_amb-isa-0000
Adapter: ISA adapter
Ch. 0 DIMM 0: +67.0°C (low = +110.5°C, high = +124.0°C)
Ch. 1 DIMM 0: +62.0°C (low = +110.5°C, high = +124.0°C)
We can see as per the output above, that our sensors and their temperature readings are detected and functioning as desired, now we need to add plugins to take this output on a “per sensor” basis so we can add it to a service check for monitoring server temperature.
4. Download the “check_lm_sensors” plugin from the link here and copy it to /usr/local/nagios/libexec. Once done, extract it via
tar -zxvf check_lm_sensors-3.1.1.tar.gz
5. We can test our new plugin as root by running:
/usr/local/nagios/libexec/check_lm_sensors-3.1.1/check_lm_sensors –list
which should again list the sensors and their temperatures. If this doesn’t work or gives Perl errors, then edit the check_lm_sensors file using nano/vim, and at the top of the script add the following:
use lib "/usr/local/nagios/perl/lib/";
6. To allow us to be able to run this command as the “nagios” user (required for check_nrpe service checks), we need to:
chmod +x /usr/local/nagios/libexec/check_lm_sensors-3.1.1/check_lm_sensors
chown –R nagios:nagios /usr/local/nagios/libexec/check_lm_sensors-3.1.1/
7. We also need to add a line to the /etc/sudoers file. As the root user, append the following line to the bottom of /etc/sudoers:
nagios ALL=(root) NOPASSWD:/usr/local/nagios/libexec/check_lm_sensors-3.1.1/check_lm_sensors
This allows the nagios user to run check_lm_sensors as root without having to authentication via password.
8. We now have to add our check commands to our agent, as we will be executing them locally on the server, and passing the output back to our Opsview server via the check_nrpe command (NRPE being Nagios Remote Plugin Executor). To do this, we need to outline what our commands are, and what we will refer to them as. To do this, we need to edit the “overrides.cfg” file, located at /usr/local/nagios/etc/nrpe_local/override.cfg.
9. We need to edit this file using a text editor such as vim or nano, i.e.
nano /usr/local/nagios/etc/nrpe_local/override.cfg
and add lines similar to below:
check_command[core0_temp]=sudo /usr/local/nagios/libexec/check_lm_sensors-3.1.1/check_lm_sensors --sanitize --high Core0=45,55

check_command[core1_temp]=sudo /usr/local/nagios/libexec/check_lm_sensors-3.1.1/check_lm_sensors --sanitize --high Core1=45,55

check_command[core2_temp]=sudo /usr/local/nagios/libexec/check_lm_sensors-3.1.1/check_lm_sensors --sanitize --high Core2=45,55

check_command[core3_temp]=sudo /usr/local/nagios/libexec/check_lm_sensors-3.1.1/check_lm_sensors --sanitize --high Core3=45,55

check_command[dimm0_temp]=sudo /usr/local/nagios/libexec/check_lm_sensors-3.1.1/check_lm_sensors --sanitize --high Ch.0DIMM0=60,75

check_command[dimm1_temp]=sudo /usr/local/nagios/libexec/check_lm_sensors-3.1.1/check_lm_sensors --sanitize --high Ch.1DIMM0=60,75

check_command[sda_temp]=sudo /usr/local/nagios/libexec/check_lm_sensors-3.1.1/check_lm_sensors --sanitize --high sdaTemp=60,75
This will create 7 new commands, such as “core0_temp”, which execute the full path specified to the right-hand side of the “=”.
10. Next, we need to reload the Opsview agent by running
service opsview-agent restart
for example.
11. We can now test these new commands as the nagios user, by navigating to /usr/local/nagios/libexec and running a command as below:
./check_nrpe –H localhost –c dimm0_temp
This will output the result, as below, if it completes successfully:
[nagios@rhelserver libexec]$ ./check_nrpe -H localhost -c dimm0_temp
LM_SENSORS WARNING - Ch.0DIMM0=67.0|Ch.0DIMM0=67.0;60;75;;
12. Now that everything is confirmed working, we simply now need to create our service checks in Opsview and add them to a host. To do this, simply log-in to Opsview, and navigate to “SETTINGS > SERVICE CHECKS” and click the green “PLUS” symbol. This will load a new page, which you will need to populate with various settings such as name, service group, etc.
The important sections for this example are Plugin and arguments; in “Plugin” we must select check_nrpe and in arguments we must enter something similar to “-H $HOSTADDRESS$ -c dimm0_temp”; where “dimm0_temp” is the command we ran earlier and added to our overrides.cfg file.
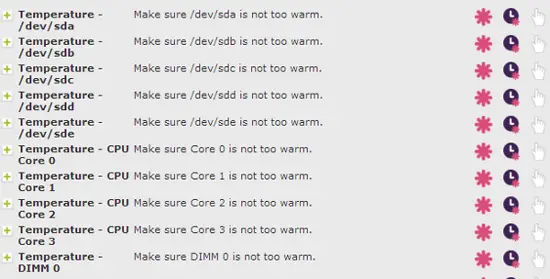
13. Once we have created service checks for all our lines we added in “overrides.cfg” on our server, we can then navigate to “SETTINGS > HOSTS”, click on the corresponding host (*or add it if its not currently in Opsview*), and navigate to the MONITORS tab where you can select your new service checks as below:
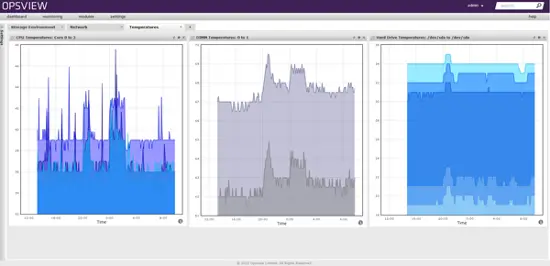
14. Once added, we finally need to reload Opsview to apply our changes, via “SETTINGS > APPLY CHANGES” and “reload configuration”. Once reloaded, we can then navigate to our host, and view our new server temperature monitors as below:
15. We can now begin to create notification profiles based upon temperatures, i.e. “Notify me if a temperature goes critical for any of my servers in Datacenter ‘XYZ’ during these times”, for example. This way we can ensure we find out instantly when a server temperature is becoming critical, via SMS/email/iOS push notifications, and investigate immediately.


