Monitoring ESX/ESXi Servers - Page 2
4. Executing basic power actions
In order to execute power actions perform the following steps:
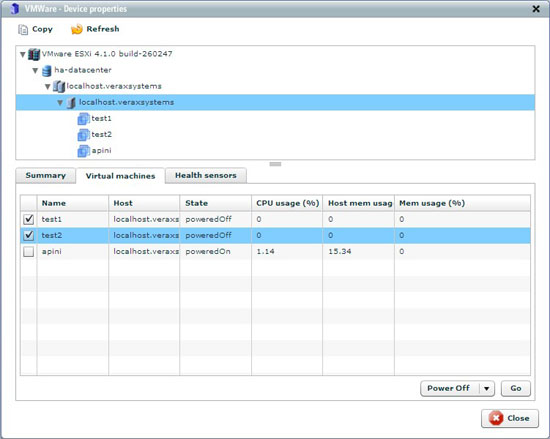
1. Select desired ESX/ESXi host and click Show advanced view from Actions section.
2. Device properties window shows up.
3. Go to Virtual machines tab. This tab shows a list of virtual machines working on a server.
4. Check desired VM/VMs and select action type from the list below the table and click Go.
Figure 8: Executing basic power actions
Note: The actual actions available are dependent on the ESX license.
5. Adding a new monitored application to the VMware host
In order to add an application to the host perform the following steps:
1. Navigate to the Home view using main menu and select desired device.
2. In Summary tab select Manage applications from actions section.
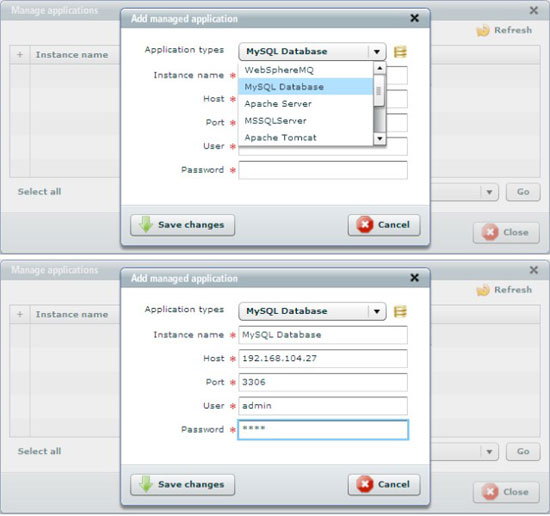
3. Select Add application and click Go. Dialog window is displayed.
Figure 9: Adding MySQL database
4. Provide the necessary information and click Save changes. Note that application specific parameters depend on application type.
Important:
Host field regards to an IP address of VM on which application is installed not the ESX/ESXi server. To check IP address of a particular VM select Advanced view option from action section.
5. The system will ask if you want to add default set of sensors and counters for MySQL database - click Yes to create the sensors.
The initial set of MySQL monitors includes:
- Configuration: software version, host platform, status and system variables
- Database instance inventory
- Predefined sensor and counter templates to monitor most important performance characteristics SQL
If you want to attach additional sensors and counter to the database, follow the procedure described in chapters 2 and 3.
6. Creating custom event processing rules for VM's
To assign processing rules perform the following steps:
1. After selecting desired host go to Events tab.
2. Select events choose Assign processing rules and click Go.
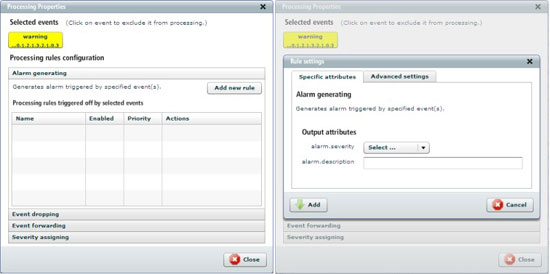
3. Select rule category and click Add new rule.
4. Dialog window is displayed (see figure below).
Figure 10: Creating custom processing rule
5. Newly created event processing rule is now visible and active (there's no need to logout).
Summary
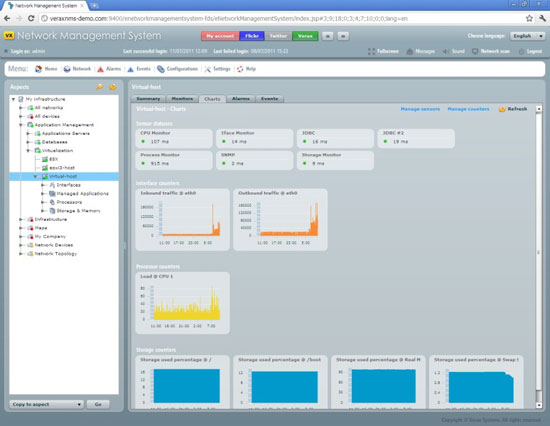
If you performed all actions described in chapters 1-6 you are now able to monitor applications (and MySQL in particular) running on your ESX/ESXi server.
Figure 11: Charts tab of fully configured ESX/ESXi server.


