Integrating Ubuntu Landscape With Opsview Enterprise
Recently we've been taking a look at the Ubuntu toolset outlined in the Openstack Keynote speech this year by Mark Shuttleworth – of particular interest was Ubuntu Landscape; their systems and server management tool that allows patching and management of 1000’s of Ubuntu servers from a single console.
The beauty of Landscape is that if you have 1000 Ubuntu servers you can update the software and patch them on the go from a single view, you can even click on each server to get the hardware and software inventories, see the reports on what processes are using the CPU etc all from a single tool.
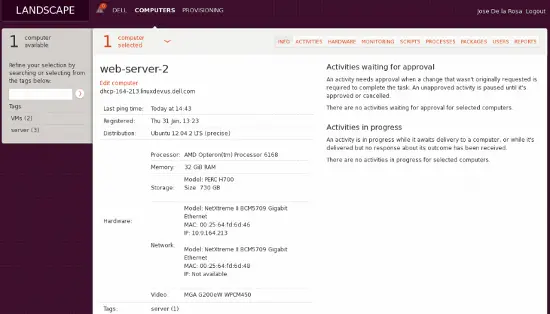
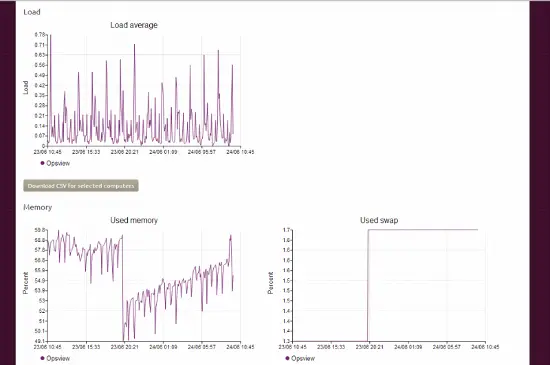
An interesting item from an Opsview perspective is that it does contain a “monitoring” tab per device. This tab is rudimentary in that it shows only the basics of monitoring (resource usage, network throughput, etc) as below:
This is presumably being sucked up / polled via the Landscape client running on the Ubuntu server and using the usual “load” etc outputs that are being parsed and sed’ed. This detail is fairly basic however so it's unlikely many people would use this as their solitary tool for monitoring as opposed to Opsview – its more of a useful add-on allowing you to check the health of 'X' while you're in the Landscpae dashboad.
However this got us thinking – what if we could still use Opsview as our main monitoring tool, which allows customers to log into to view their systems via a dashboard, email reports, send SMS alerts, etc but integrate this Opsview data into the Landscape dashboard – so it's possible to click on “Server100” in Opsview, and “Server100” in Landscape, and see the same graphs. This could allow us to see the health of the server, no matter which tool we're using.
To do this in Landscape it is actually fairly simple (once you get used to the nuances of the system). Firstly, from our main console we must navigate to “Custom graphs” as below:
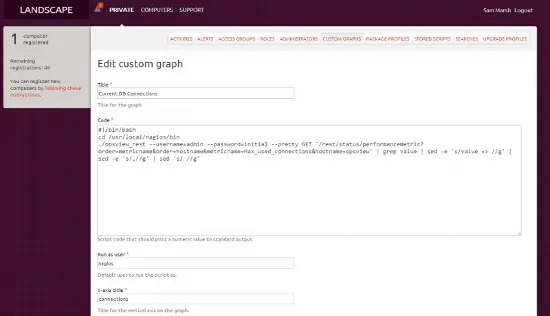
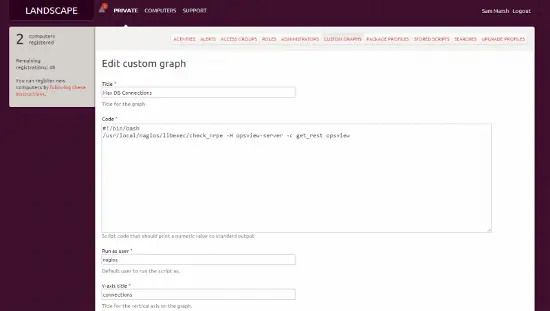
Next we must click on “Add custom graph” which brings up a page like below (we’ve saved time by populating the field already):
As it may be difficult to read on the image, the “code” is pasted below:
#!/bin/bash
cd /usr/local/nagios/bin
./opsview_rest --username=admin --password=initial --pretty GET '/rest/status/performancemetric?order=metricname&order=hostname&metricname=Max_used_connections&hostname=opsview' | grep value | sed -e 's/value => //g' | sed -e 's/,//g' | sed 's/ //g'
This basically uses the opsview_rest command to connect to the Opsview monitoring system and get the metric “max_used_connections” from the host “opsview” and then does some sedding/grepping to give us a graphable value i.e. “28”, rather than “value=>28;21;s…” which Ubuntu doesn’t like :)
What this allows us to do is have our Opsview monitoring system added as a Landscape host and allow us to monitor the health of the monitoring system via Landscape, along with the health of any other host being monitored by the Opsview system – and any service check running against it. We can get this information by running the command:
opsview_rest --username=admin --password=initial --pretty GET /rest/status/performancemetric/?hostname=opsview
Where “?hostname” is the host we are trying to view the performance data of. Once this is configured and saved as per the previous screenshot, we need to set our “run as user:” (either root or a different user) and “Y Axis title” (seconds, db connections, temperature, etc). Once done, we click “Save” and this will be applied to all hosts (if you’ve ticked the box).
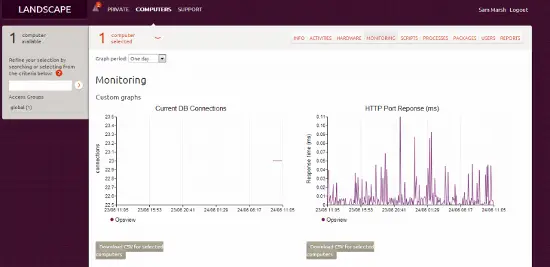
Then, after a day or so, we can go to the host and view the “monitoring” tab and see our custom graphs:
…and that’s how we can integrate Opsview with Ubuntu Landscape.
The Challenge
The challenge next faced was that the Landscape-managed device runs the command:
./opsview_rest --username=admin --password=initial --pretty GET '/rest/status/performancemetric?order=metricname&order=hostname&metricname=Max_used_connections&hostname=opsview'
..which uses “opsview_rest” via bash and runs locally. What would be ideal is to run this from anywhere (i.e. the server we are managing in Landscape) but still run against our Opsview system. The latter is easy; we can add a prefix as below:
./opsview_rest --url-prefix=monitoringtool.company.com --username=admin --password=initial --pretty GET '/rest/status/performancemetric?order=metricname&order=hostname&metricname=Max_used_connections&hostname=opsview'
…but this still relies on the command “opsview_rest”, which obviously has to be available on the local box as the custom graphs run the script locally on the Ubuntu Landscape managed system. And also this exposes the username and password to the host server, i.e. your web server now has login details to Opsview. However, we can restrict the latter issue by allowing that role very specific access to just read only, and just read-only a few specific items.
What we need is the ability to have the host which is being monitored by Opsview and managed by Ubuntu Landscape, to have the ability to query Opsview via the REST API about its own health - so that it can provide this information back to Landscape for graphing. However we cant distribute opsview_rest due to Perl issues, dependencies, etc, so what can we do?
The only item which seems to work or satisfy our criteria is to use check_nrpe the “non-traditional way”. What I mean by that, is that traditionally NRPE is a client side program that is queried by Opsview for information – i.e. “How busy is your CPU? How full are your disks?”. These values are then passed back to Opsview, and stored for reports, dashboards and the likes and used for alerting.
What we found in this example, is that we could install the NRPE Client (Opsview Agent) on the monitored/managed host and use that to query NRPE running on the Opsview master.
On this Opsview master, we would specify our NRPE commands in “/usr/local/nagios/etc/nrpe_local/overrides.cfg” (this file doesn’t exist, you need to create it) and add the lines as below:
############################################################################
# Additional NRPE config file for Opsview
############################################################################
check_command[get_rest]=/usr/local/nagios/bin/landscape_monitor.pl $ARG1$ $ARG2$
Where “get_rest” is the command we will be calling remotely, and anything “east of the equals” is the actual command that is being ran locally.
You can see from the above, that we are running something called “landscape_monitor.pl” – a Perl script we wrote to take the host argument (i.e. $ARG1$ could be “server00156” or “networkswitch-X624” in Opsview (the ‘hostname’)). This means instead of having to create a check_command for each i.e.:
check_command[get_rest]=/usr/local/nagios/bin/landscape_monitor.pl server1
check_command[get_rest2]=/usr/local/nagios/bin/landscape_monitor.pl server2
check_command[get_rest3]=/usr/local/nagios/bin/landscape_monitor.pl server3
We can just use $ARG1$ and have our Perl script expect it. Next, we have the actual script (this uses JSON and IPC so we need the following packages installed on the Opsview system: libipc-run-perl libjson-any-perl)
#!/usr/bin/perl Shell
use strict;
use warnings;
use IPC::Run qw(run);
use JSON;
my $hostname = $ARGV[0] || '';
my $perf_metric = $ARGV[1] || '';
my @cmd = qw(/usr/local/nagios/bin/opsview_rest --username admin --password initial --data-format json GET);
push @cmd, '/rest/status/performancemetric?order=metricname&order=hostname&metricname='. $perf_metric .'&hostname='. $hostname;
run \@cmd, \undef, \my $out;
my $data = decode_json($out);
print $data->{list}->[0]->{value};
As we can see above, we take a variable (the hostname) and add it to the opsview_rest command we are building. We also also take the performance metric and after running the built command, we then print the command output from the JSON format – “23” in our example. This saves us having to grep / sed the hell out of it to get the actual value that Landscape can use.
So, once you’ve added your script “landscape_monitor.pl” to /usr/local/nagios/bin/, and chmod / chown’d it – you can go ahead and create the overrides.cfg file and add the line as above.
Finally, start NRPE on the monitored/managed device – and we are ready to rest as below.
Scenario
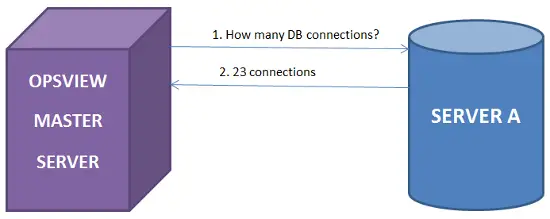
Stage 1: We have the standard monitoring environment; Opsview monitors “Server A” and asks for information such as DB statistics, apache statistics, etc and displays this information in dashboards to users via the GUI, sends email/text message, alerts, etc when problems arise.
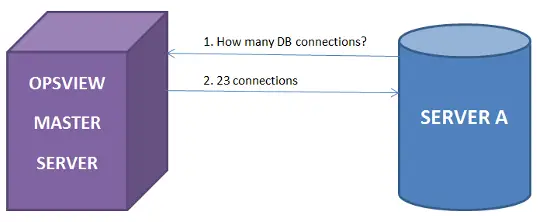
Stage 2: Now that Opsview is gathering thousands of metrics and statistics from our servers, we can use the REST API to query those statistics from the monitored server, i.e. “Server A”, using the perl script above. To do this, we simply run the commands as below:
./check_nrpe -H opsview-master-server -c get_rest -a serverA Max_used_connections
ubuntu@serverA:/usr/local/nagios/libexec$ ./check_nrpe -H opsview-master-server -c get_rest -a serverA Max_used_connections
23
ubuntu@serverA:/usr/local/nagios/libexec$
By using check_nrpe on ServerA and passing our hostname, i.e “ServerA”, we can see the max_db_connections value that Opsview has for us.
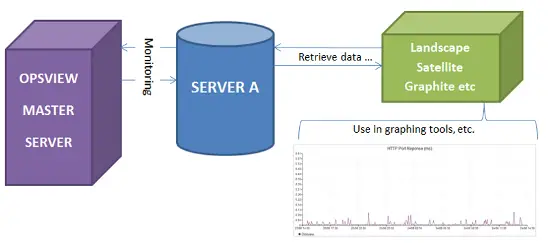
Stage 3: Because we now have the ability for the monitored device, to know its own metrics – the possibilities of what we can do are endless. In our example, we simply want to use Landscape to graph our Opsview-gathered metrics so we can have access to the graphs “at a glance” in our Landscape system along with being able to dive into Opsview to see reports / dashboards and the more monitoring-specific items. However, there is nothing stopping us from using this technology to integrate Opsview with other graphing tools, etc.
To integrate this with Landscape, it’s very simple. We simply need to create another “Custom Graph” as we outlined earlier in the document, and in the text box add:
#!/bin/bash
cd /usr/local/nagios/bin
./check_nrpe –H opsviewserver –c get_rest -a servername max_used_connections
Finally, we apply this graph to the one host we want to – and voila, we are now monitoring the “max DB connections” of the server, via Landscape. We can then build on this, change the metric, etc so in essence you can see all the Opsview gathered metrics, from within Ubuntu Landscape, RH Satellite, etc.
A final look
So in theory, we now have the following scenario:
- 100 Ubuntu servers being managed and patched etc by Ubuntu Landscape.
- 100 Ubuntu servers being monitored and alerted on etc by Opsview Enterprise.
We would have the hosts added to both Landscape and Opsview, and we would use Opsview for the more granular level of monitoring, alerting, reports, dashboards, NetFlow, etc and then suck in the particularly interesting ‘at a glance’ metrics into that hosts Landscape page.
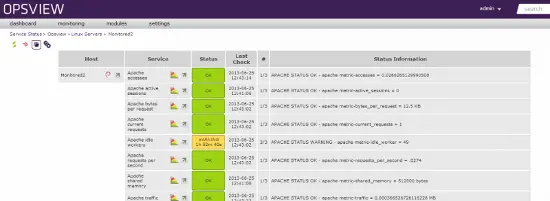
Host in Opsview
The host is added in Opsview as above – we can see all the metrics, graph on them, control when they are monitored, change metrics based upon time period, etc.
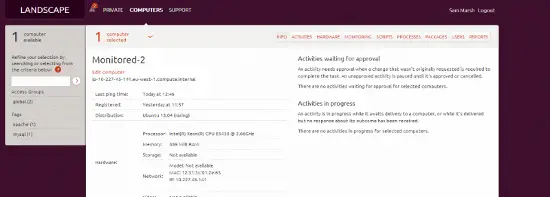
Host in Landscape
We also have the host in Landscape – from this view we can see the asset (hardware, etc), update packages, see reports on the health of the system, etc. We can also click on “Monitoring”, and see our Opsview gathered ‘at a glance’ information, from within Landscape, as below:
(albeit, a much underused Apache server! ^_^ ).

