Install and configure Grafana with Prometheus on the AWS Ubuntu 18.04 LTS EC2 Instance.
On this page
Prometheus: Prometheus is an event Monitoring and Alerting tool. It is an open source tool built at SoundCloud.
Grafana: Grafana is an open source visualisation and analytics tool.
Node-Exporter: Node_Exporter is a Prometheus exporter for hardware and operating systems metrics. Installing Node_Exporter is quite simple as it comes with a single binary.
Setup Details:
In this article, we will use 2 Ubuntu 18.04 LTS EC2 instances. On one node, we will install Prometheus and on the other we will install Grafana and Node_Exporter.
- Node1 : Prometheus, DNS: ec2-15-188-52-60.eu-west-3.compute.amazonaws.com/
- Node2: Grafana, Node_Exporter. DNS: ec2-15-188-50-16.eu-west-3.compute.amazonaws.com/
Node_Exporter will export metrics from Node2 to Prometheus on Node1, Prometheus will then scrape these metrics. Grafana will be configured with source as Prometheus to fetch metrics from it and the metrics will then be displayed on Grafana.
This document will help you with the installation, configuration and integration of Prometheus, Grafana and Node_Exporter to visualise metrics on Grafana.
Pre-requisites
- AWS Account (Create if you don’t have one).
- 2 Ubuntu 18.04 LTS VMs or EC2 Instances (Click here to learn to create an EC2 Instance).
- Root access to the servers.
Note: If you are using EC2 Instances, you may be charged for using EC2 instances. Delete the instances from your account if you no more need them.
What we will do?
- Install Prometheus
- Install Grafana
- Install Node-Exporter
- Integrate Grafana with Prometheus
Install Prometheus
Install the package:
Installing Prometheus is very simple and straight. Use the following commands to install it
wget https://s3-eu-west-1.amazonaws.com/deb.robustperception.io/41EFC99D.gpg | sudo apt-key add -
sudo apt-get update -y
sudo apt-get install prometheus prometheus-node-exporter prometheus-pushgateway prometheus-alertmanager -y
Start Prometheus:
Once the installation is successful you can now start the Prometheus using the following command.
sudo systemctl start prometheus
Enable Prometheus to start on boot time:
To make sure that Prometheus starts itself when the system boots/reboots, enable it to start on boot time using the following command.
sudo systemctl enable prometheus
Check status of Prometheus:
To be sure that the Prometheus has started check its status. Refer the following screenshot to see how the output looks like.
sudo systemctl status prometheus
Access Prometheus:
Once the installation is done and the Prometheus has started successfully, it can be accessed on port 9090. You can use the public DNS of the EC2 instance to access Prometheus on port 9090, make sure that Port 9090 is enabled in security groups.
URL: http://IP-Of-Prometheus-Instance:9090/
Install Grafana
Install the package:
Grafana can be installed using the following commands in a very simple and straight way.
sudo apt-get install -y apt-transport-https
sudo apt-get install -y software-properties-common wget
wget -q -O - https://packages.grafana.com/gpg.key | sudo apt-key add -
sudo add-apt-repository "deb https://packages.grafana.com/oss/deb stable main"
sudo apt-get update
sudo apt-get install grafana
sudo systemctl daemon-reload
Start Grafana:
Use the following command to start Grafana.
sudo systemctl start grafana-server
Enable Grafana to start on boot time:
To enable Grafana to start on system boot, use the following command.
sudo systemctl enable grafana-server.service
Check status of Grafana:
Use the following command to check the status to make sure it is up and running.
sudo systemctl status grafana-server
Access Grafana:
Upon successful installation and start up of Grafana, you can access it on port 3000. Enable the port 3000 in the security group if you are using an EC2 instance.
URL: http://IP-of-Grafana:3000/
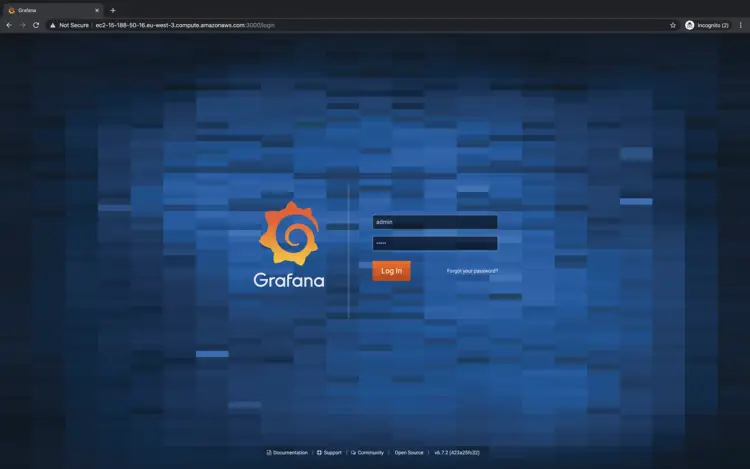
For the first time you login in to Grafana, enter admin as username and password.
You will be asked to change your username and password.
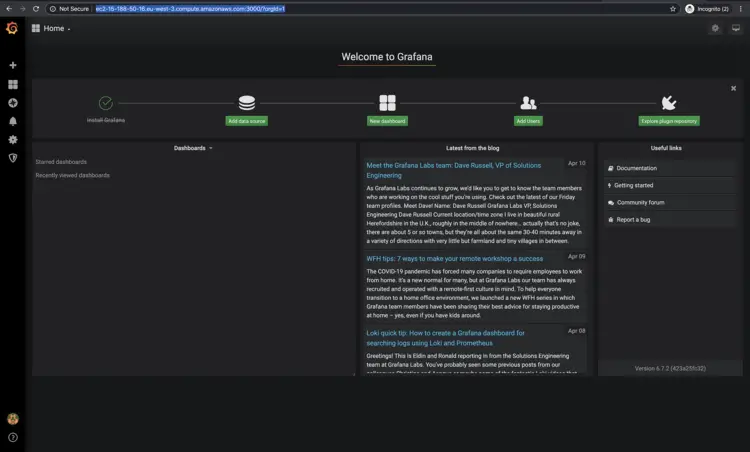
You can see the following screen once you change the username-password and successfully login into Grafana.
Install Node-Exporter
You can download the Node_Exporter version of your choice from the following link or use the following commands to download node-exporter-1.0.0. Once you download the tar file, you just need to extract it and copy the binary to /usr/local/bin/.
Link to checkout different versions of node_exporter:
https://prometheus.io/download/#node_exporter
Install the package:
cd /tmp/
wget https://github.com/prometheus/node_exporter/releases/download/v1.0.0-rc.0/node_exporter-1.0.0-rc.0.linux-amd64.tar.gz
tar -zxvf node_exporter-1.0.0-rc.0.linux-amd64.tar.gz
cp node_exporter-1.0.0-rc.0.linux-amd64/node_exporter /usr/local/bin/
Configure Node-Exporter:
vim /etc/systemd/system/node_exporter.service
Open /etc/systemd/system/node_exporter.service using the above command and add the following configuration in it.
Change the User and Group to the one that will be used to start the Node_Exporter Service. Here, have specified root as the User and Group as I shall be using root user to start the service.
[Unit]
Description=Prometheus Node Exporter
Wants=network-online.target
After=network-online.target

[Service]
User=root
Group=root
Type=simple
ExecStart=/usr/local/bin/node_exporter

[Install]
WantedBy=multi-user.target
Reload Configurations of Node-Exporter:
Once the configurations are in place we need to reload those configurations so that the changes can be identified by the system. Use the following command to reload the changes
systemctl daemon-reload
Start Node-Exporter:
Use the following command to start node_exporter service
systemctl start node_exporter.service
Enable Node-Exporter to start on boot time:
systemctl enable node_exporter.service
Check status of Node-Exporter:
To make sure that the service has started just check its status by executing the following command You should see the output has the one in the following image.
systemctl status node_exporter.service
Access Node-Exporter:
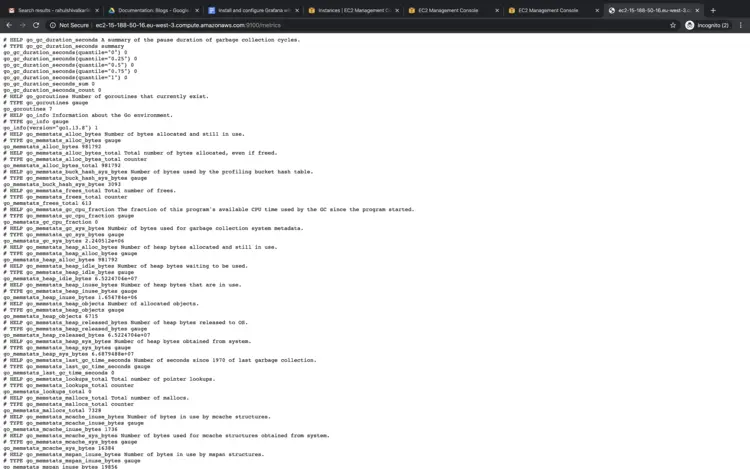
Node_Exporter starts on port 9100, Allow this port in the security group.
URL: http://IP-of-Node-Exporter:9100/
Integrate Grafana with Prometheus
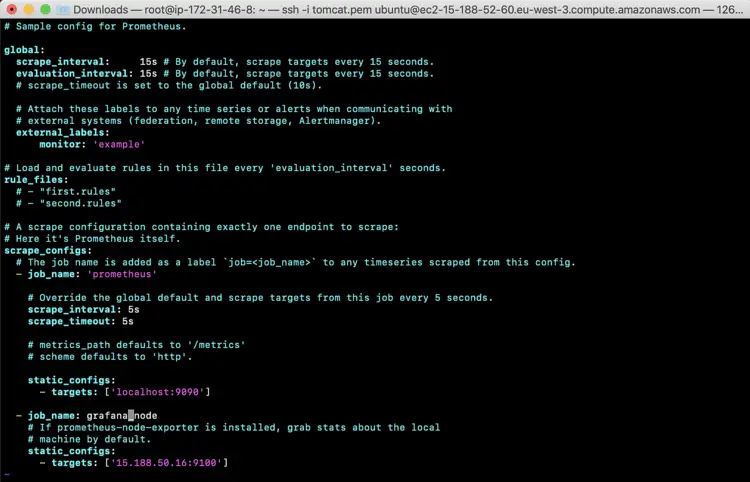
To scrape metrics on Prometheus exported by the Node_Exporter, we need to add the IP of the Node_Exporter in the configuration file of Prometheus. In the following screenshot you can see that the IP of the Node_Exporter has been added under 'job_name:grafana_node'. Make the same changes in your configuration file
vim /etc/prometheus/prometheus.yml
Restart Prometheus:
sudo systemctl start prometheus
Access Prometheus:
Access the Prometheus on your browser and under execute query history execute type the query "up" and execute it.
URL: http://IP-of-Prometheus:9090/
Once you execute the query you can see under the console that, "the elements up has the value 1". This means that the Prometheus could scrape values for localhost and Node_Exporter and finds that these two elements are up. This is just one of the metrics which Prometheus now has with it and can be accessed from Grafana.
Configure Grafana, add Prometheus in it.
URL: http://Ip-of-Grafana:3000/
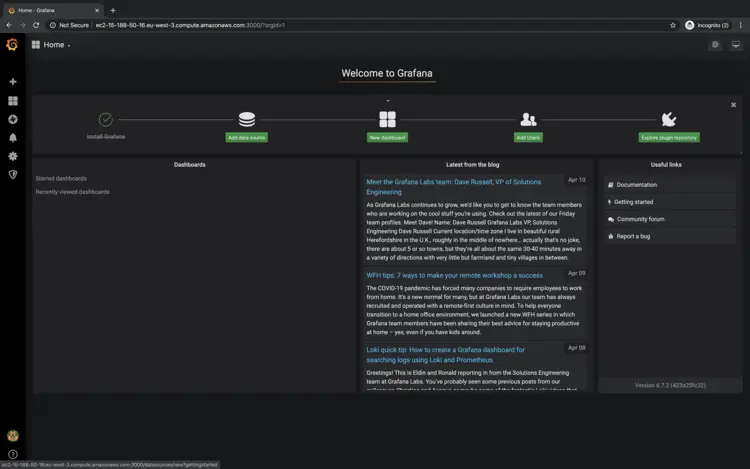
On the welcome screen now you can add Prometheus to Grafana under "Add data source". Click on "Add data source".
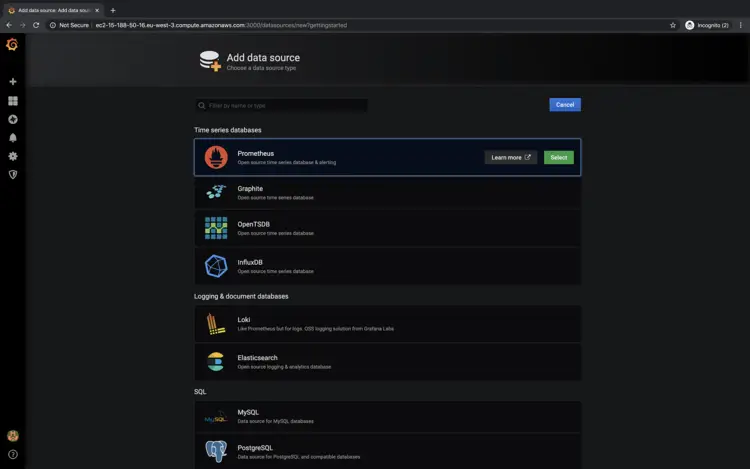
Select Prometheus.
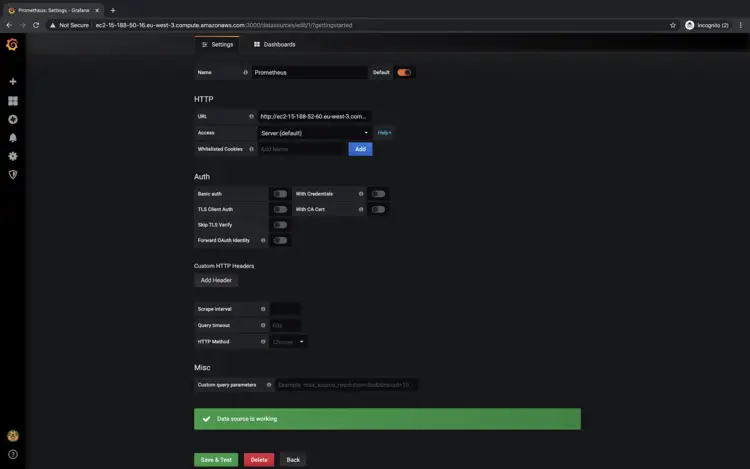
Add URL of the Prometheus server "http://IP-Of-Prometheus-Instance:9090/" under "HTTP--> URL" field and click on "Save & Test".
Execute Queries on Grafana to check Metrics Exported by Node-Exporter to Prometheus
The metrics which were available on Prometheus can be now accessed from Grafana.
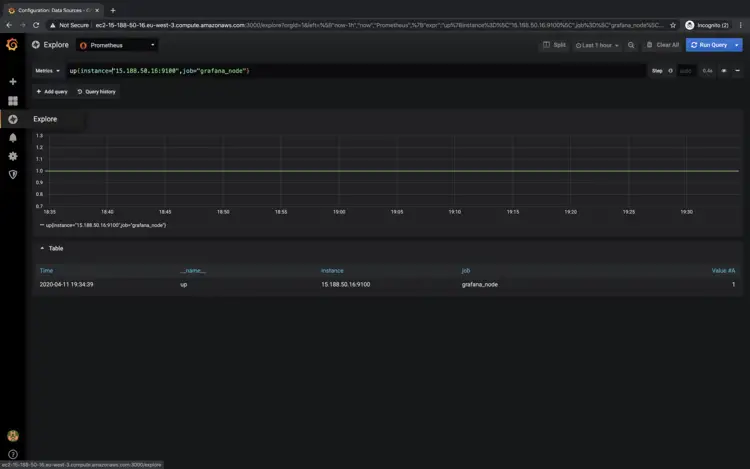
Go to explore and try to execute those queries.
Examples:
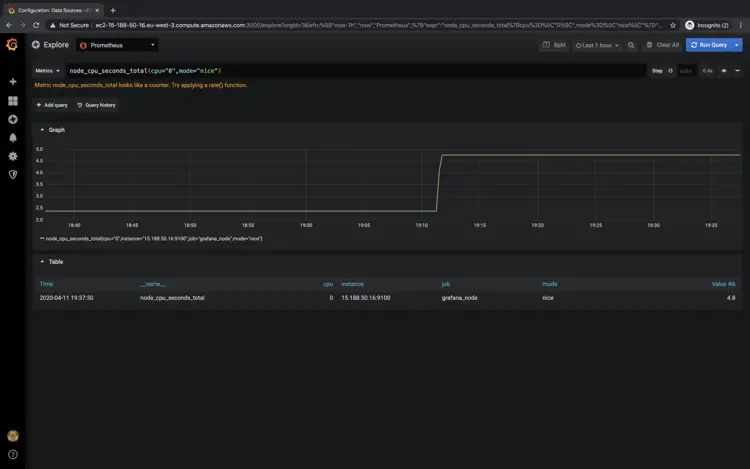
- node_cpu_seconds_total{cpu="0",mode="nice"}
- up{instance="15.188.50.16:9100",job="grafana_node"}
Once you run queries on Grafana, you can see metrics in graphical format as the one in the following screenshots.
You can try different metrics and play with them
Conclusion
In this article we saw the steps in detail to install Prometheus, Grafana and Node_Exporter, installation of these tools is pretty simple and straight. We also saw how Prometheus can be configured to scrape metrics exported by Node_Exporter by adding Node_Exporter's IP in Prometheus's configuration file and use Grafana to visualise them.


