How To Use Nagios Plugins In Verax NMS
This guide shows how to use Nagios plugins to monitor devices in Verax NMS Express. Verax NMS is a cross-platform network and application monitoring software.
Tools used:
- Sample Nagios plugin for CPU check in a Shell Script format (.sh file) http://exchange.nagios.org/directory/Plugins/System-Metrics/CPU-Usage-and-Load/Check-CPU-LOAD-using-SNMP/details
- Verax NMS Express ver. 1.9.5: http://www.veraxsystems.com/en/products/nms
Adding Nagios Plugin To The Device
First, download a plugin. In this example I will use plugin for checking CPU usage over the SNMP (check_snmp_cpu.sh).
Put plugin in a folder on the same server where Verax NMS Express is installed. In my case it will be:
/root/nagios/check_snmp_cpu.sh
Note: Make sure that folder containg the plugin has the right file permissions (CHMOD: 777).
Now, let's add shell script sensor to the device:
- Log into the Verax NMS, select Home from the main menu and select the right device from the aspects tree.
- In Monitors tab select Add option and click Go. The system will display a pop-up dialog with sensors available for your device.
- Select Shell Script Sensor from the sensors tree and click Next.
- Now you have to specify your sensor parameters.
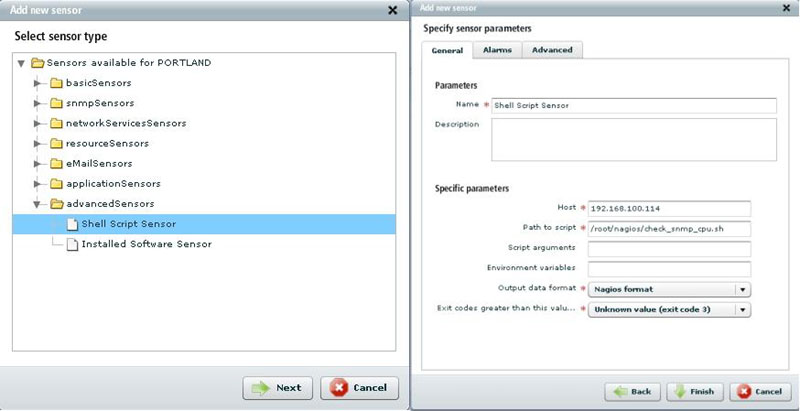
System will ask you to enter the following sensor-specific parameters:
- Host - in most cases, the host address is an IP address of the device.
- Path to script - path to the script file located on the server where Verax NMS Express is installed.
/root/nagios/file_name.sh
For me it's:
/root/nagios/check_snmp_cpu.sh
- Output data format - an output data format which is expected to be returned by the script.
- Ignore - only the return code/time of response is taken into account.
- Nagios format - format of the script output is compatible with Nagios.
In this case set out format to "Nagios" which is by default: 'label'=value[UOM];[warn];[crit];[min];[max]
- Script arguments (not mandatory) - arguments are passed due to the uploaded script. You can use the following placeholders in the arguments:
- %DEVICE_IP% - IP address of the device.
- %SNMP_COMMUNITY% - SNMP community string for the device.
- %TIMEOUT% - Timeout value for the sensor.
- %WARNING_THRESHOLD% - Value for the warning threshold for the sensor.
- %CRITICAL_THRESHOLD% - Value for the critical threshold for the sensor.
- Environment variables (not mandatory) - provide a simple way to share configuration settings between multiple applications and processes in Linux. Each of the variables should be definied as "key=value" and they should be separated by ";".
- Exit codes greater than this value [warning (exit code 1), error (exit code 2), unknown value (exit code 3)] - it means that if the script's exit code will be greater than or equal to chosen return code, sensor's execution will result with error.
- Click Finish to confirm.
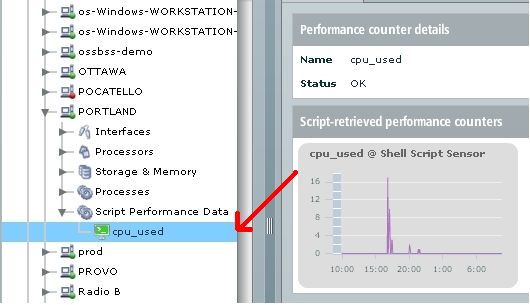
- Sensor is now added and will be visible in the Aspects tree.
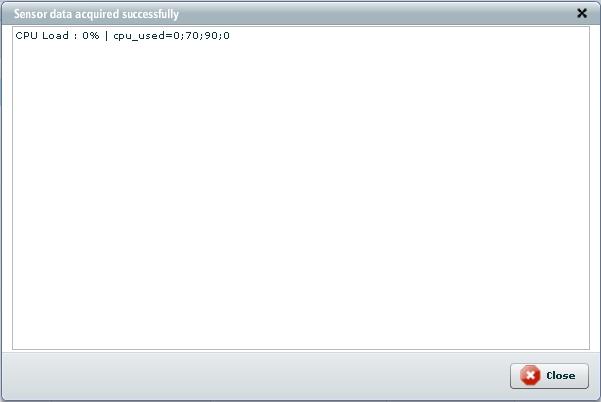
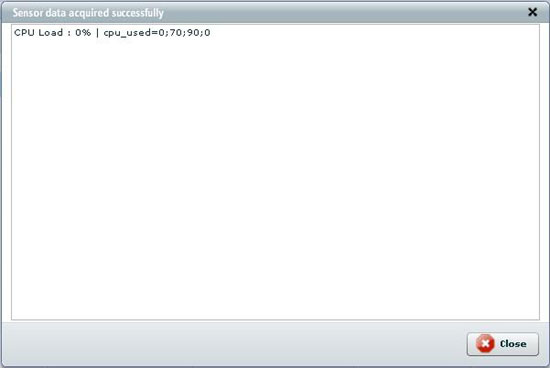
- In order to check if the sensor is working properly, select Execute script and show output option from local actions menu. If everything's OK system will display pop-up dialog with a script's response. It should look like this:
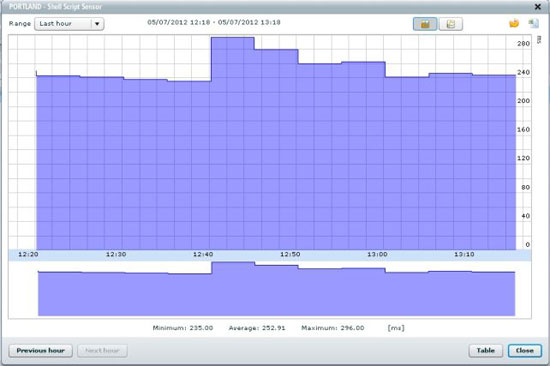
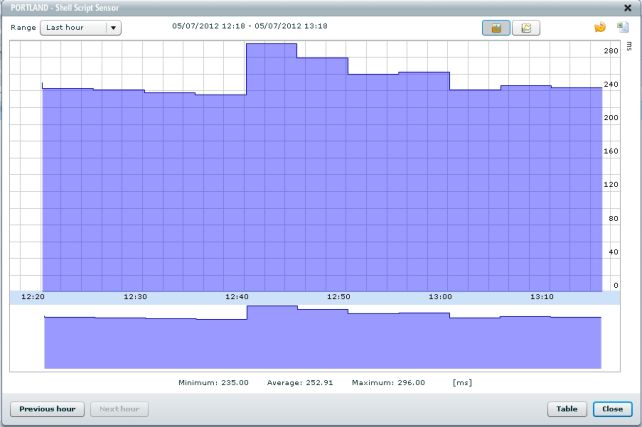
If you performed all actions described in this guide Nagios plugin will now monitor your device and its responses will be presented on a performance chart.