How To Set Up Advanced Call Center Monitoring Using Free Tools
In this tutorial, I'll try to demonstrate how to set up monitoring for a small call center based on Cisco hardware and software using free monitoring system (Verax NMS & APM in that case). The architecture of your call center may be different; however the procedure itself will stay more or less the same:
- Adding devices and configuring monitors
- Creating an aspect that groups call center infrastructure elements (presents the status of the entire call center based on statuses of all its components)
- Creating a custom dashboard for call center metrics
Tools:
- Free version of Verax NMS & APM (http://www.veraxsystems.com/en/products/nms)
- SNMP Object Navigator (optional, if you want to dive deeper into Cisco's metrics) (http://tools.cisco.com/Support/SNMP/do/BrowseOID.do?local=en)
- Free MIB browser e.g. iReasoning MIB browser (optional, see above) (http://ireasoning.com/mibbrowser.shtml)
Let's assume that our contact center is built as presented in this picture:
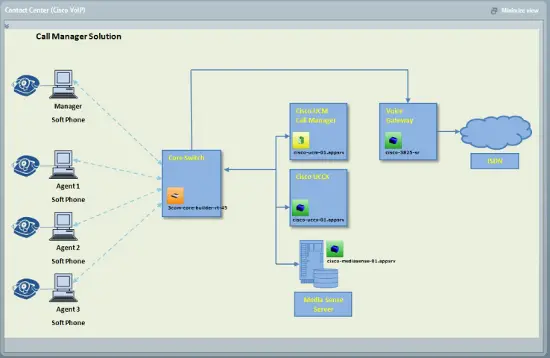
So, we have a few soft phones, Cisco MediaSense, UCCX (Contact Center Express), UCM (CallManager), Cisco 3825 VoIP gateway and general network switch all connected as shown on the picture.
Step 1: Adding devices
First of all, we need to add all devices. We can do it either via automated discovery or manually. In this case let's add them manually and then use multi-edition to automatically rediscover them.
- Log in into the system and navigate to Network view.
- Select Add from menu and click Go.
- Now let's just provide Name and IP address and confirm by clicking Add.
- A pop-up dialog is displayed asking whether system can discover the device - click No as we'll use mass editing for this later.
- Repeat this procedure for the remaining devices.
Important: Remember about providing the proper device login credentials.
Now, in order to automatically assign device's type, category and default monitors we have to let the system rediscover those devices, so:
- Select all recently added devices in Network view.
- Select Rediscover selected and click Go.
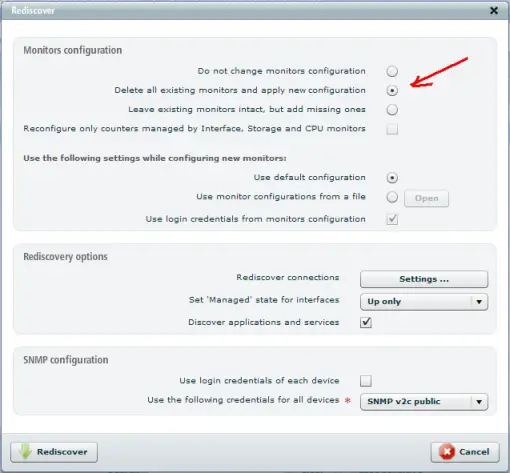
- The pop up will show up, do not change anything but remember about the right login credentials.
- Click Rediscover and the system will assign the appropriate device categories, default monitors, etc.
Important:
If you had those devices monitored before make sure to select "Delete all existing monitors and apply new configuration" option before rediscovering.
Now, we have all components added to the device inventory and they'll be visible in Network view as well as in the Aspect tree under the all-devices node.
Step 2: Adding additional monitors (optional)
As mentioned before during the rediscovering system will assign all default monitors, however if you want to add any additional monitors (e.g. Active Calls sensor for Cisco gateway) perform actions as described below:
- Select a specific device from the aspect tree in the Home view.
- Select Monitors tab and switch to desired list by clicking Sensor list/Counter list in the upper-right corner of the tab field.
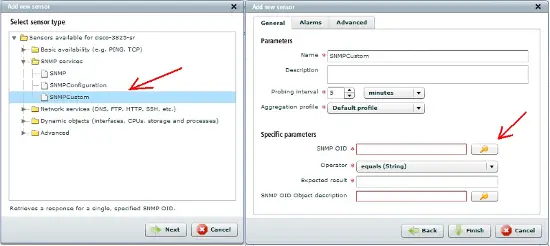
- Select Add from the global actions menu and click Go. The wizard dialog is displayed.
- Select the sensor-counter you want to add and click Next.
- A dialog shows up with all sensor parameters to be provided. Specify the sensor parameters and click Finish.
- Once the sensors/performance counters have been added, they are visible on the sensor list/counter list (Monitors tab).
Important:
If you're using different devices or want to add some additional custom monitors the best way to do so, is to download and import device specific MIBs and then select SNMPCustom option while adding a sensor/counter. This will allow you to create any other sensor/counter based on the SNMP OID values.
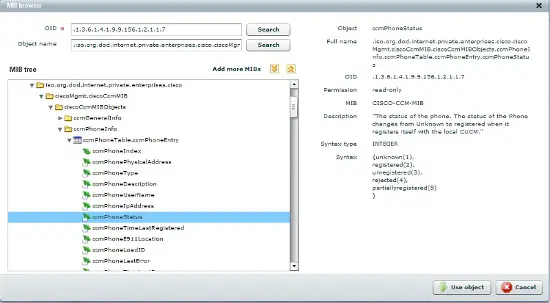
For example, you can download CISCO-CCM-MIB mib file from Cisco's SNMP Object Navigator for creating dozens of detailed sensors for Cisco CallManager itself.
In order to add new MIB file navigate to Settings view and go to MIB Manager, select Add and then point your MIB file and confirm by clicking Add.
Step 3: Creating an aspect
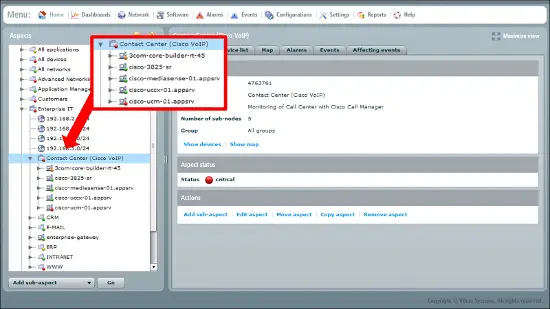
Now, let's create a separate aspect grouping all components of our call center's infrastructure.
- Go to Home view and select the "My infrastructure" node (the top node) in the aspect tree.
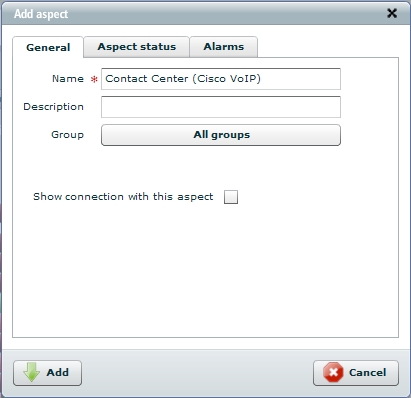
- Select Add aspect option from menu below the aspect tree and click Go.
- Provide name and select Most critical object option in Aspect status tab, so the overall status of this aspect will be equal to the most critical status of contained objects.
- Click Add to confirm.
Now, we have an empty aspect and we need to add devices to it:
- Select All devices aspect from the aspect tree and system will display the list of all devices in the right window pane.
- Select your newly added devices (Cisco MediaSense, UCCX , UCM, Cisco 3825 voip gateway and switch).
- Choose "Copy devices to aspect" option and click Go.
- Select Cisco aspect and confirm by clicking Save changes.
Now, we have complete aspect containing our call center's infrastructure elements. As mentioned before the overall status of this aspect will be equal to the most critical status of contained objects.
STEP 4: Creating a custom dashboard
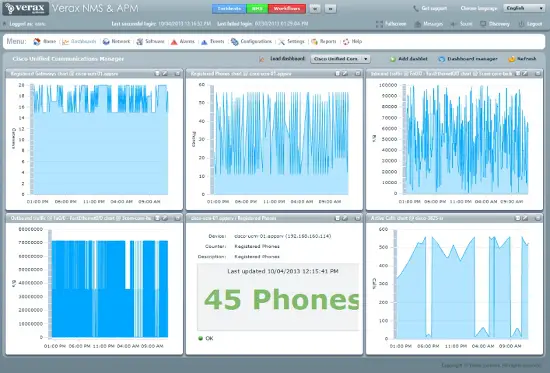
The last part is creating dashboard presenting the most important metrics for our call center.
- Navigate to Dashboards view and click Dashboard manager option in the upper-right corner of the tab field.
- Select Add and click go.
- Provide name for your new dashboard and click Finish.
- Load new dashboard by selecting Load option form menu in dashboard manager.
The new dashboard is created and now we have to add dashlets with selected metrics:
- Click Add dashlet in the upper-right corner of the tab field.
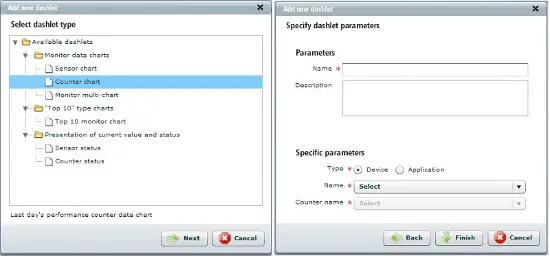
- Select dashlet type and click Next.
- Provide name for you dashlet and select parameters: dashlet type (device), name (select desired device) and sensor/counter name (your desired metric).
- Click Finish to confirm.
You can add up to 8 dashlets to a single dashboard.
Summary and troubleshooting
If you take actions presented below correctly and in given order you should be able to set up monitoring for your call center infrastructure, even if you're using different hardware components the procedure stays the same: add devices, add sensors, create an aspect, create a dashboard.
In case of any troubles make sure that you provided a proper Login credentials during adding devices also make sure to add all required files if you're using device specific MIBs (remember that sometime there are multiple sub-MIBs).


