How to Install Sensu Monitoring Solution on Debian 11
Sensu is an open-source infrastructure and application monitoring system designed for both container and non-container monitoring and multi-cloud infrastructure. Sensu is a scalable, secure, and integrated monitoring solution for your technology and server infrastructure. It can be used to monitor servers, application health, and services, and send alerts notification to multiple targets with third-party integration.
In this tutorial, you will learn how to Install Sensu Monitoring Software on Debian 11 server. You will also learn how to set up Sensu CLI for managing Sensu. Finally, you will learn how to set up server monitoring with Sensu through Sensu Agent.
Prerequisite
For this Sensu deployment, you will need the following requirements:
- One Debian 11 Server with 4 GB of RAM and 2 CPUs. This requirement is very dependent on your infrastructure environment.
- A non-root user with sudo/administrator privileges.
- A Linux machine will be used as the target to monitor.
Adding Sensu Repository
To get started with Sensu installation, you will need to add the Sensu package repository to all of your systems, both Sensu Backend, and target servers.
Sensu repository is available on packagecloud.io, which can be added to your system manually or via the bash script provided by packagecloud.io.
Before adding the Sensu repository, run the apt command below to install basic package dependencies. Press Y and Enter when prompted to confirm the installation.
sudo apt install debian-archive-keyring curl gnupg apt-transport-https
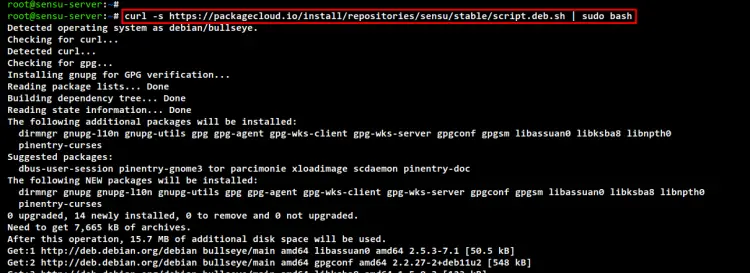
Now run the following command to add the Sensu repository. This bash script will automatically add the Sensu repository and GPG key to your Debian servers.
curl -s https://packagecloud.io/install/repositories/sensu/stable/script.deb.sh | sudo bash
If you want to manually add the Sensu repository, follow these steps:
Create a keyring directory for storing the GPG key of the Sensu repository.
mkdir -p /etc/apt/keyrings/
curl -fsSL https://packagecloud.io/sensu/stable/gpgkey | gpg --dearmor > /etc/apt/keyrings/sensu_stable-archive-keyring.gpg
Add the Sensu repository using the following command. This repository is for the Debian 11 Bullseye and the latest stable version of Sensu.
cat <<EOF | sudo tee /etc/apt/sources.list.d/sensu_stable.list
deb [signed-by=/etc/apt/keyrings/sensu_stable-archive-keyring.gpg] https://packagecloud.io/sensu/stable/debian bullseye main
deb-src [signed-by=/etc/apt/keyrings/sensu_stable-archive-keyring.gpg] https://packagecloud.io/sensu/stable/debian bullseye main
EOF
Now you can update and refresh your Debian package index using the following apt command.
sudo apt update
Installing Sensu Backend
The main heart of the Sensu monitoring solution is a "Sensu Backend", which provides an HTTP API that can be used by an administrator via the "sensuctl" command line. WebSocket API that will be used by "Sensu Agent" for monitoring, and also provides a web UI dashboard for managing Sensu.
Also, Sensu used "etcd" for storing data, especially on large Sensu Cluster deployment.
To install Sensu Backend, run the apt command below. The installation will automatically begin.
sudo apt install sensu-go-backend
After installation is finished, download the sample of Sensu backend configuration to "/etc/sensu/backend.yml". Then, edit the file "/etc/sensu/backend.yml" using the following command.
sudo curl -L https://docs.sensu.io/sensu-go/latest/files/backend.yml -o /etc/sensu/backend.yml
sudo nano /etc/sensu/backend.yml
Uncomment the following configuration.
cache-dir: "/var/cache/sensu/sensu-backend"
config-file: "/etc/sensu/backend.yml"

log-level: "debug"
state-dir: "/var/lib/sensu/sensu-backend"
When you are done, save and close the file.
Next, run the following systemctl command to start the Sensu Backend service and enable it. And the Sensu Backend service will automatically be running at system startup.
sudo systemctl start sensu-backend
sudo systemctl enable sensu-backend
Check and verify the Sensu backend service using the below command. You should see the Sensu Backend service is currently running and enabled.
sudo systemctl status sensu-backend
After the Sensu backend is running, you will now initialize Sensu Backend installation and configuration. This can be done by using the command line "sensu-backend init", which is provided by the Sensu Backend package.
Also, during the Sensu Backend initialization, you will set up the admin user and password for your Sensu Monitoring Solution.
Run the following command to create new system environment variables for the Sensu admin user and password. In this example, you will create a new Sensu admin user "adminsensu" with the password "SensuRocks".
export SENSU_BACKEND_CLUSTER_ADMIN_USERNAME=adminsensu
export SENSU_BACKEND_CLUSTER_ADMIN_PASSWORD=SensuRocks
Now start to initialize the Sensu backend using the below command. You should see the initialization process and Sensu will store data inside the "etcd" data store.
sensu-backend init
To check and verify your Sensu backend installation, you will do the Sensu health check via the curl command to the Sensu HTTP API that running on default port "8080".
Run the curl command below to do the health check of your Sensu backend installation. You should see the output message on your terminal screen such as "health: OK".
curl http://127.0.0.1:8080/health
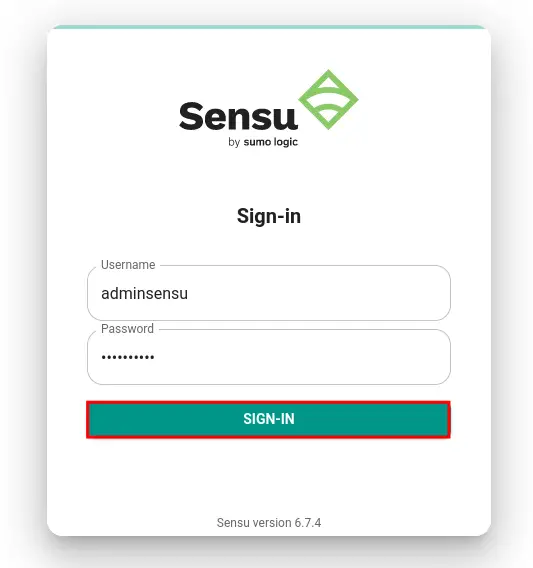
You can also visit the Sensu web UI dashboard via the TCP port "3000". Open your web browser and visit your server IP address following port 3000 (i.e: http://192.168.5.100:3000). And you should see the Sensu login page.
Input the admin user "adminsensu" with the password "SensuRocks". Then, click "SIGN-IN" to log in to the Sensu web UI dashboard.
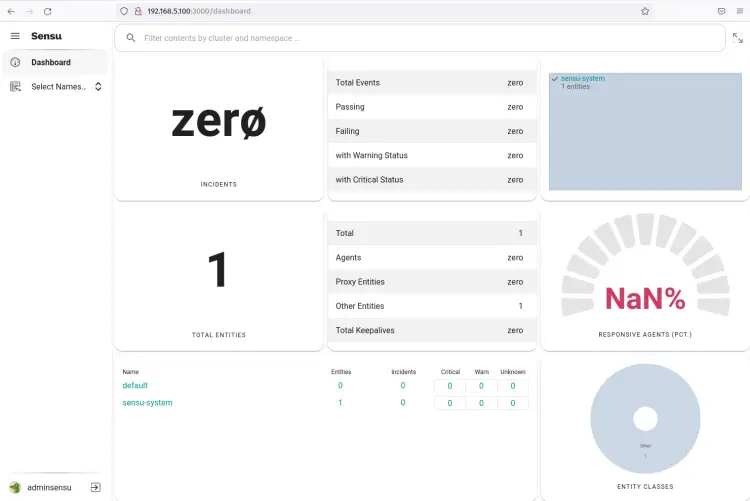
Now you should see the Sensu web administration dashboard.
Installing Sensuctl Command Line
On Sensu, the administrator can manage the Sensu Monitoring Solution via the Sensu web UI administration dashboard and via the command-line terminal by using "sensuctl".
The "sensuctl" is a command-line tool for managing Sensu resources. It's used an HTTP API to communicate with Sensu Backend, which allows you to create, read, and delete resources, events, and entities.
The "sensuctl" can be installed on multiple operating systems such as Linux, Windows, and macOS. The function of "sensuctl" is similar to the Sensu web UI dashboard, and you can install it on your local workstation or the secure "bastion" server of your infrastructure.
For Debian/Ubuntu-based systems, run the following apt command below to install the "sensuctl" command-line tool. The installation will automatically begin.
sudo apt install sensu-go-cli
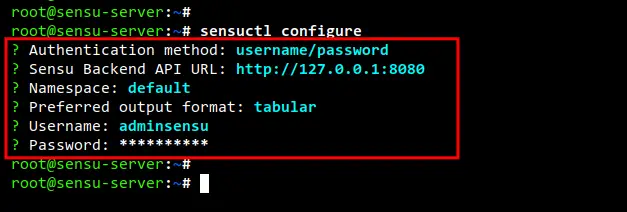
After installation is finished, run the following "sensuctl" command to start configuring and connecting to the API of the Sensu Backend server.
sensuctl configure
You will be prompted with the following configurations:
- For the authentication method, select the "username/password".
- Input the Sensu Backend API URL of your server. In this example, we will set up "sensuctl" on the same server, so the host will be localhost or "127.0.0.1". And the default port for Sensu HTTP API is "8080" - http://127.0.0.1:8080.
- For the namespace configuration, select "default".
- For the output format, you can select the "tabular" style or use the "yaml" output format.
- Lastly, input the admin user and password for your Sensu Backend.
Now you have completed the "sensuctl" basic configuration and connected to the Sensu Backend API server.
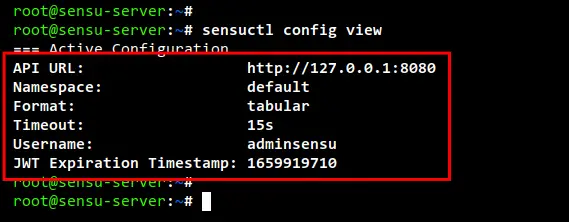
Run the following "sensuctl" command below to check your configuration. You should see detailed API configurations of "sensuctl".
sensuctl config view
Additionally, the "sensuctl" also provides an auto-complete for your shell. If you are using bash, you need to install the "bash-completion" package and add some configuration to the "~/.bashrc" config file.
Run the following apt command to install the "bash-completion" package.
sudo apt install bash-completion
Now eidt the "~/.bashrc" configuration using the following command.
sudo nano ~/.bashrc
Add the following configuration to the file.
if [ -f /usr/share/bash-completion/bash_completion ]; then
. /usr/share/bash-completion/bash_completion
elif [ -f /etc/bash_completion ]; then
. /etc/bash_completion
fi

source <(sensuctl completion bash)
When you are finished, save and close the file.
Next, reload the current session of your shell using the below command.
source ~/.bashrc
Lastly, input the command "sensuctl" and press the TAB button to get all available command options. You should get all available options of the "sensuctl" command.
sensuctl TAB
Installing Sensu Agent
To monitor the host or machine using Sensu, you must install the Sensu Agent package on all of your hosts. The Sensu Agent is available for almost Linux distributions and Windows.
To install Sensu Agent on a Linux system, ensure the Sensu repository is added.
For Debian/Ubuntu-based system, run the following apt command to install the Sensu Agent package. Now the installation will begin.
sudo apt install sensu-go-agent
After installation is finished, download the Sensu Agent configuration to "/etc/sensu/agent.yml". Then, edit the configuration "/etc/sensu/agent.yml" using the below command.
sudo curl -L https://docs.sensu.io/sensu-go/latest/files/agent.yml -o /etc/sensu/agent.yml
sudo nano /etc/sensu/agent.yml
Uncomment these following configurations. be sure to change the "name" here to the system hostname and the "backend-url" with the IP address of the Sensu Backend server.
In this example, we will add a Debian machine with the hostname "linux-host1" and available on the "default" namespace. The Sensu Backend server here is "192.168.5.100" with the default WebSocket API port of Sensu Backend "8081".
name: "linux-host1"
namespace: "default"
...
backend-url:
  - "ws://192.168.5.100:8081"
cache-dir: "/var/cache/sensu/sensu-agent"
config-file: "/etc/sensu/agent.yml"
When you have finished, save and close the file.
Next, run the following command to start the Sensu Agent service and enable it to run automatically at system boot.
sudo systemctl start sensu-agent
sudo systemctl enable sensu-agent
Now run the following command to check and verify the Sensu Agent service. You should see the Sensu Agent is running and enabled.
sudo systemctl status sensu-agent
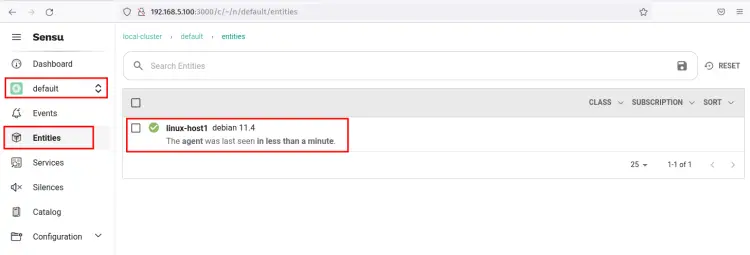
Next, back to your web browser and select the namespace "default". And you should see the new entity host "linux-host1" is available.
You can also check from the terminal command line using the "sensuctl" command as below. You should see the agent "linux-host1" added to the Sensu Monitoring Solution.
sensuctl entity list --format tabular
Monitor Server Resources with Checks
The Sensu Agent works to just provides a way for the agent node or target server to the Sensu Backend through the WebSocket API. To monitor server resources such as CPU usage, bandwidth usage, and Disk usage, you will need to set up "Subscription" and create some "Check" on top of it. Then, you can add multiple "Subscriptions" to Sensu Agent or the target server.
To monitor server resources using Sensu, you will need to do the following steps:
- Create Subscription
- Register Sensu Runtime Assets
- Define Checks command for checking system resources
Before going any further, run the following "sensuctl" command to create a new subscription named "system" to the "linux-host1" entity.
sensuctl entity update linux-host1
You will be prompted with the following questions:
- For the 'Entity Class", leave as default "agent" and press ENTER.
- For the "Subscriptions", input the name of the subscription "system" and press ENTER.
On Sensu, "Checks" basically just defined a command that can be used to monitor server resources. "Checks" is the command line that you can define on top of Sensu "Assets" and "Subscriptions" for all your monitoring needs. To create "Checks", you will set up dynamic runtime assets via the "sensuctl" command. All Sensu "Assets" can be found on https://bonsai.sensu.io/.
Now run the "sensuctl" command below to create and register Sensu "Assets" to monitor CPU usage. You should see the output message such as "added asset: sensu/check-cpu-usage:0.2.2". In this example, we also rename the default name of the asset to "check-cpu-usage" with the option "-r".
sensuctl asset add sensu/check-cpu-usage:0.2.2 -r check-cpu-usage
Now run the following command to check the list of Sensu assets. You should see the asset "check-cpu-usage" are available on Sensu.
sensuctl asset list
Next, run the following command to create the "Checks" command for monitoring CPU usage. In this example, you will create a new check command name "check_cpu" which will be available on the "system" subscription and based on the asset "check-cpu-usage". You can also change the parameter here in the "--command" option. And you should get the output message such as "Created".
sensuctl check create check_cpu \
--command 'check-cpu-usage -w 75 -c 90' \
--interval 60 \
--subscriptions system \
--runtime-assets check-cpu-usage
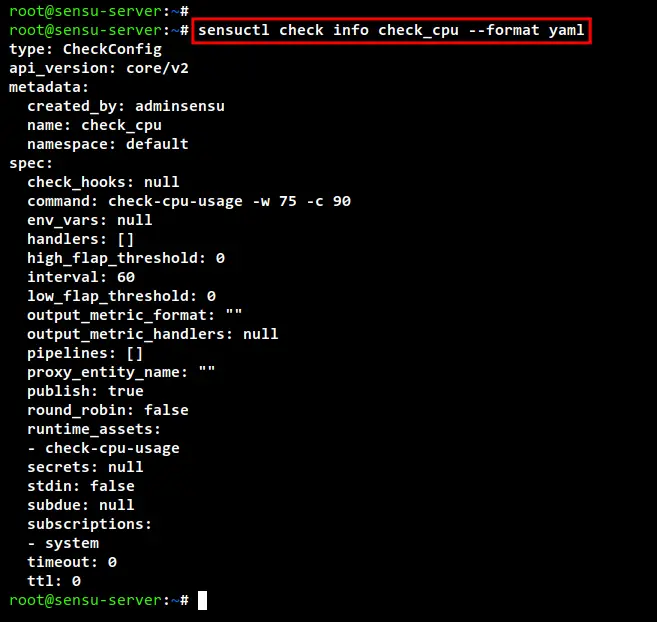
Run the following "sensuctl" command to check and verify the "check_cpu". You should see the details of "Checks" of the "check_cpu" that you just created.
sensuctl check info check_cpu --format yaml
Now you can verify the "check_cpu" event monitoring using the below command. You should see the CPU usage monitoring for "linux-host1" is configured and finished.
sensuctl event list --format tabular
Now move to the Sensu administration dashboard and select the "default" namespace. On the "Entity" menu, you should get the "linux-host1" agent added to the Sensu monitoring System.
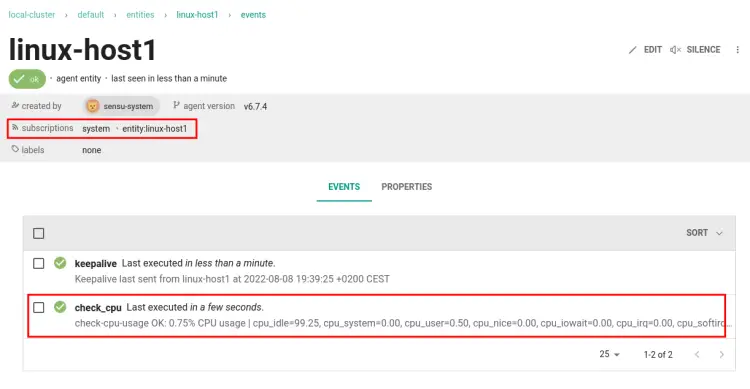
Now if you click the details of the "linux-host1" agent, you will see the "Checks" monitoring "check_cpu" that you just created.
Next, you can add and create more "Checks" for your monitoring system.
Conclusion
You have now performed the installation of Sensu Monitoring Solution on Debian 11 Server. You have also learned the basic usage of the Sensuctl command for managing the Sensu backend. Additionally, you have successfully monitored the Linux host machine via the Sensu Agent and set up "checks" for monitoring your target server.

