How to Monitor Nginx using Netdata on Ubuntu 16.04
Netdata is an open source monitoring tool for Linux servers. It provides real-time performance and health monitoring with a beautiful dashboard and analytics. Netdata should run on any Linux distribution, it has been tested on Alpine Linux, Arch Linux, CentOS, Ubuntu etc. It is monitoring CPU, memory usage, IPv4 and v6, user application such as Nginx, fail2ban, MySQL, MongoDB etc.
In this tutorial, I will show you how to monitor Nginx using Netdata. The tutorial will cover the Nginx web server installation, enable the 'stub_status' module in Nginx and the Netdata installation on Ubuntu 16.04 Xenial Xerus.
What we will do:
- Install Nginx Webserver.
- Install Netdata Monitoring Tool on Ubuntu 16.04.
- Enable Nginx 'stub_status' Module.
- Configure Netdata to Monitor Nginx.
- Configure UFW Firewall.
- Testing.
Prerequisite
- Ubuntu 16.04 server
- Root privileges
Step 1 - Install Nginx Webserver
The first step we need to do is installing the Nginx webserver from the repository. Update the Ubuntu repository before installing Nginx using apt update command.
apt update
Install Nginx from Ubuntu repository using apt install command below.
apt install -y nginx
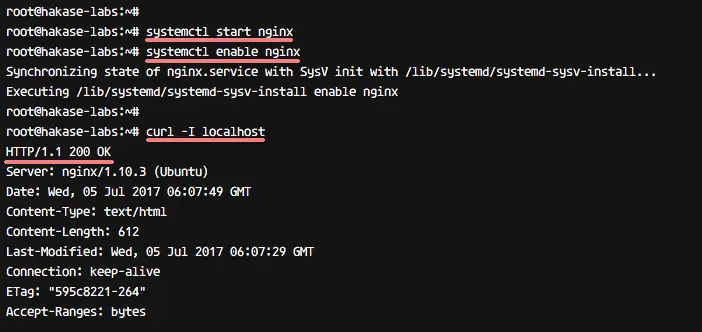
When the installation is complete, start Nginx and add it to start automatically at the boot time using systemctl commands.
systemctl start nginx
systemctl enable nginx
The webserver is running, check it with curl.
curl -I localhost
Make sure you have a result of '200 OK' http status as in the screenshot below.
The Nginx web server has been installed.
Step 2 - Install Netdata Monitoring Tool on Ubuntu 16.04
In this step, we will install the Netdata monitoring tool from the source. I will install it manually using the installer provided. Before installing Netdata, we need to install some packages needed.
Install packages needed for Netdata installation using apt install command below.
apt install -y zlib1g-dev uuid-dev libmnl-dev gcc make git autoconf autoconf-archive autogen automake pkg-config curl
When all packages have been installed, download the source code of Netdata from github using git command.
git clone https://github.com/firehol/netdata.git --depth=1
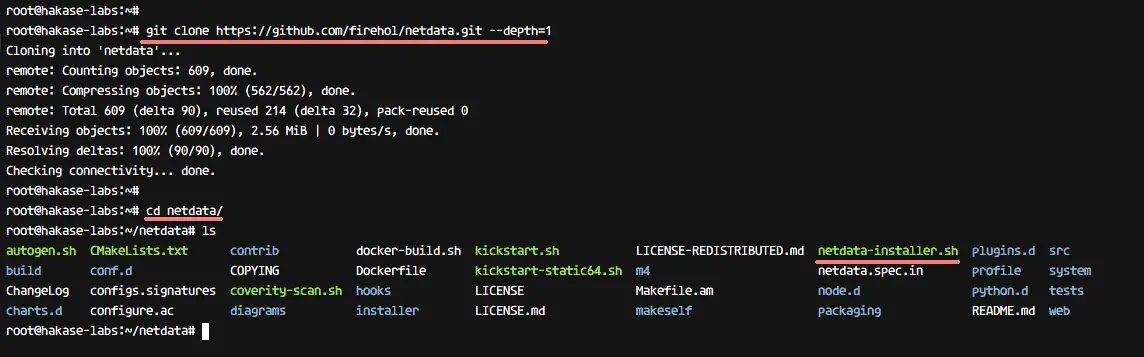
Go to the 'netdata' directory and run the installer script 'netdata-installer.sh' with sudo privileges.
cd netdata/
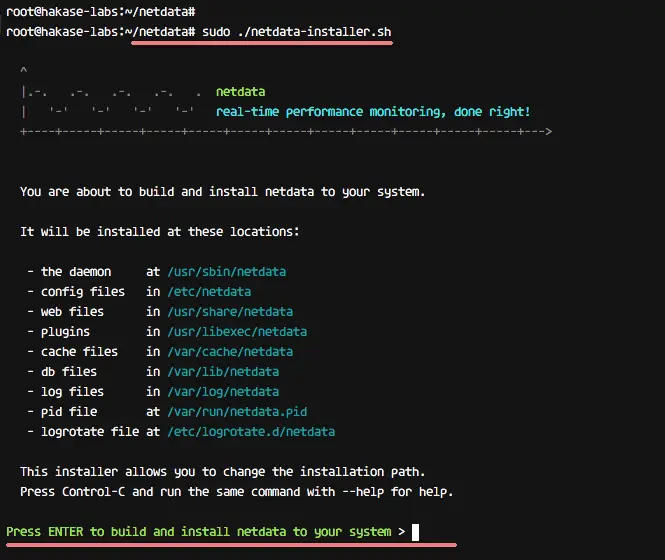
sudo ./netdata-installer.sh
Press 'Enter' to continue Netdata installation.
When the installation has been completed, you will get the result as below.
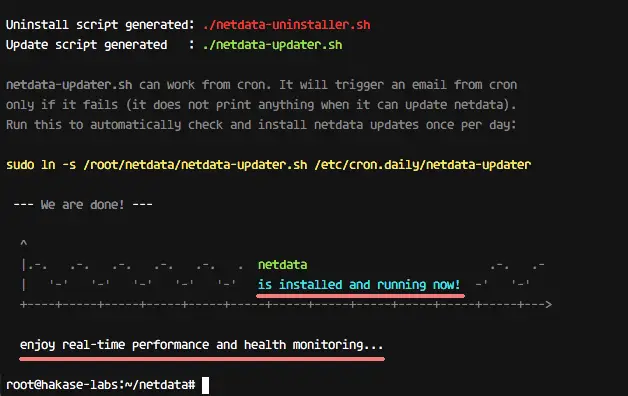
Netdata monitoring tool provides a service script for the systemd system. Start netdata and add to run automatically at the boot time using systemctl commands below.
systemctl start netdata
systemctl enable netdata
By default, it's running on port 19999, check the port with netstat and make sure you have port 19999 on the 'LISTEN' state.
netstat -plntu
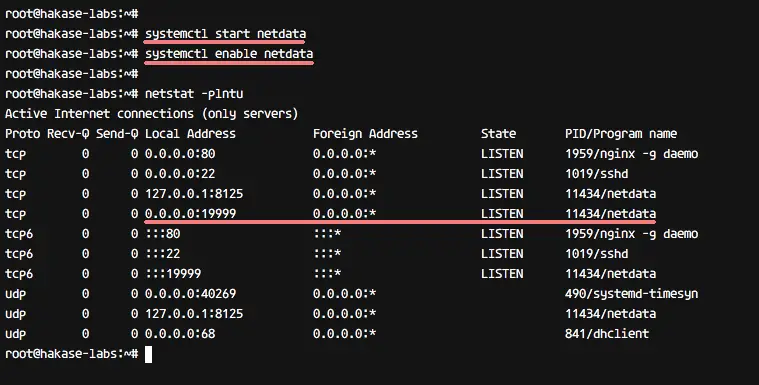
The Netdata Monitoring Tool has been installed.
Step 3 - Enable Nginx 'stub_status' Module
To monitor Nginx web server using Netdata monitoring tool we need some additional configuration. Fisrt, we have to enable the nginx 'stub_status' module to the virtual host configuration.
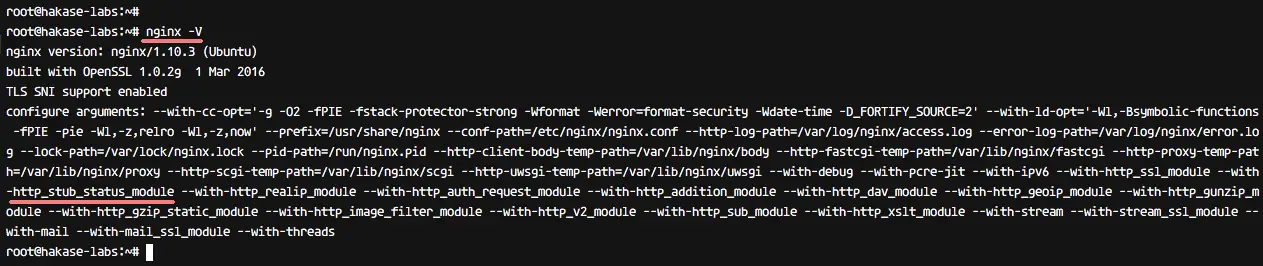
Before editing the virtual host configuration, make sure you have installed a nginx version with 'stub_status' module on it. Check it with command below.
nginx -V
Make sure you have a 'stub_status' module as below.
Next, go to the nginx configuration directory and edit 'default' virtual host file with the vim editor.
cd /etc/nginx/sites-available/
vim default
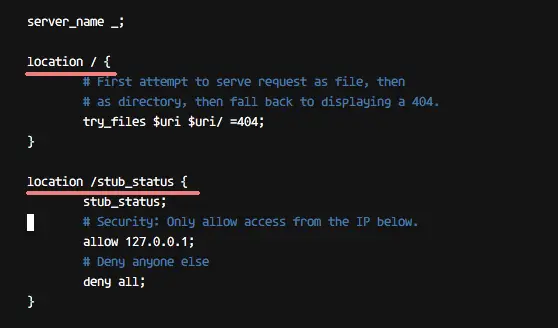
Paste configuration below to the 'server {}' block.
    location /stub_status {
        stub_status;
        # Security: Only allow access from the IP below.
        allow 127.0.0.1;
        # Deny anyone else
        deny all;
    }
Save and exit.
Test the nginx configuration and make sure there is to error and restart the nginx service.
nginx -t
systemctl restart nginx
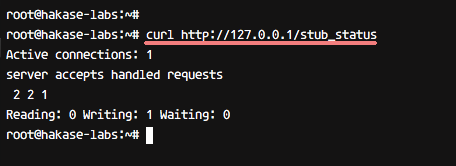
Nginx 'stub_status' module has been enabled, check it using netstat command below.
curl http://127.0.0.1/stub_status
And you will get the result as below.
Step 4 - Configure Netdata to Monitor Nginx
Netdata provides Python modules for monitoring our installed applications on the system, including Nginx web servers. To monitor Nginx using Netdata, we need the Nginx module 'stub_status' and it has been enabled already.
Now go to the netdata configuration directory. And then edit nginx.conf file in the python.d directory.
cd /etc/netdata/
vim python.d/nginx.conf
Make sure you have the configuration as below.
localhost:
  name : 'local'
  url  : 'http://localhost/stub_status'
Save the file and exit vim.

Now restart Netdata using systemctl.
systemctl restart netdata
Netdata configuration for Nginx monitoring has been completed.
Step 5 - Configure UFW Firewall
In this tutorial, I will enable the Ubuntu firewall UFW. I will open HTTP and HTTPS ports, and then open new port 19999 for Netdata Dashboard access.
Make sure you have installed the UFW firewall package, if not, use the command below to install it.
apt install -y ufw
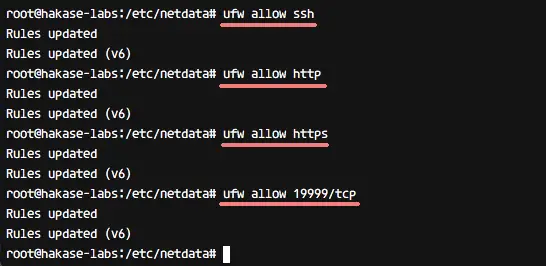
Now open the ports for ssh, http, https and netdata port 19999 using 'ufw allow' commands below.
ufw allow ssh
ufw allow http
ufw allow https
ufw allow 19999/tcp
Next, start the UFW firewall and add it to start automatically at the boot time.
ufw enable
Type 'y' to yes and press 'Enter'.
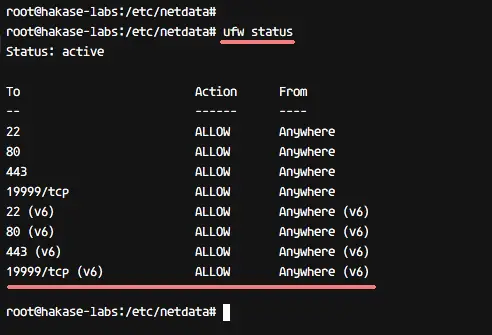
When you're done with this, check the firewall status as below.
ufw status
And you will get new ports is on the list as below.
Step 6 - Testing
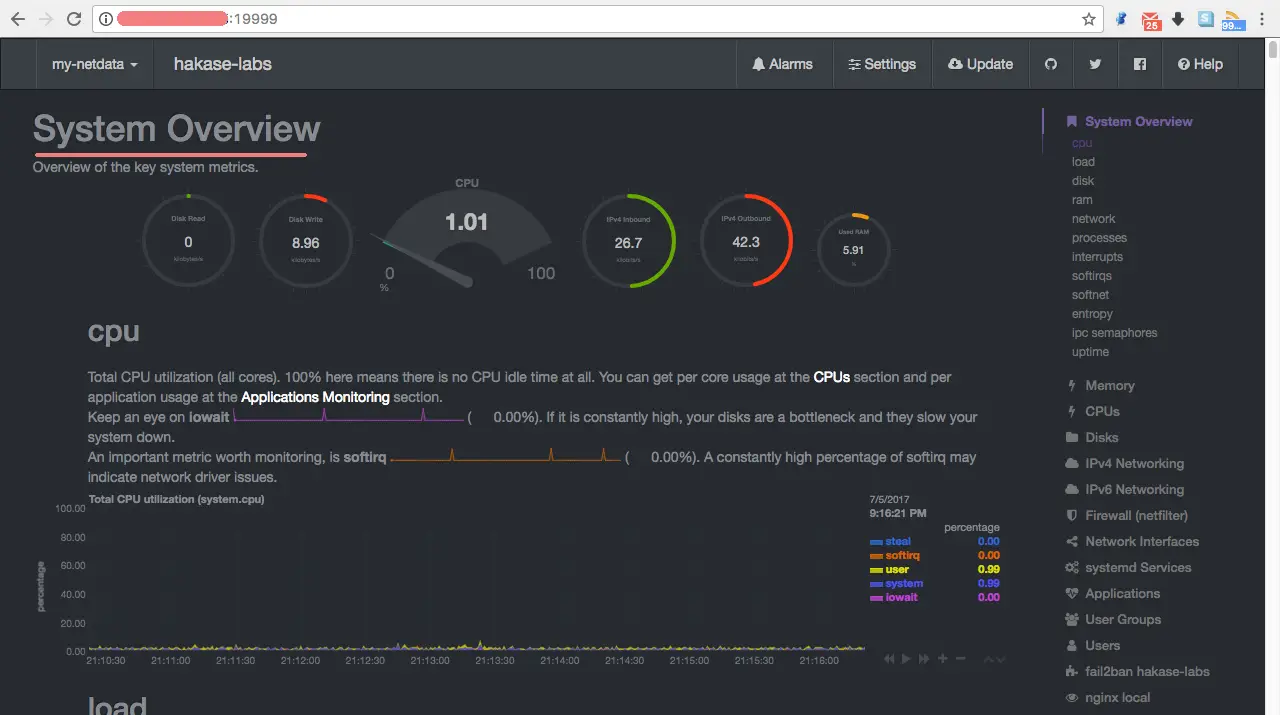
Open your browser and type in the server address with port 19999.
You should see the Netdata Dashboard.
Click on the 'nginx local' on the right, and see Nginx active connections, requests, status and the Connection rate.
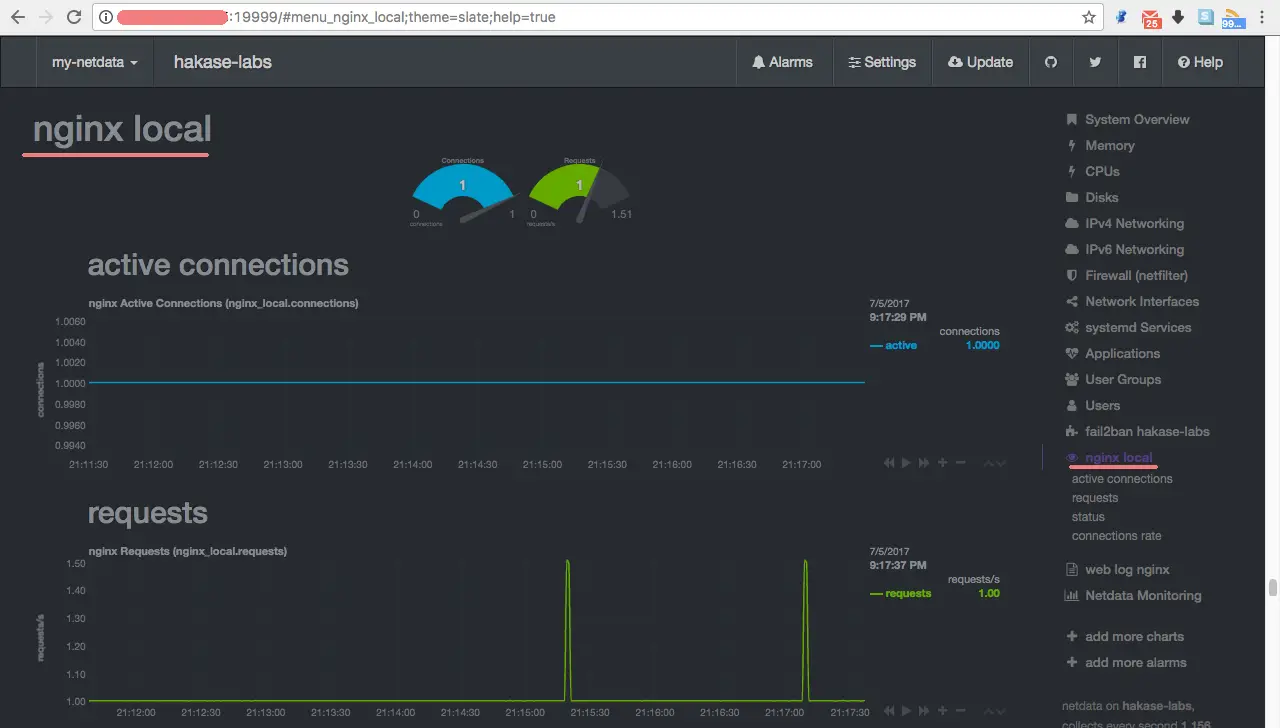
The Nginx web server is now monitored using Netdata, and Netdata has been installed on the Ubuntu 16.04 server.

