Network Analysis With Wireshark On Ubuntu 9.10
Version 1.0
Author: Falko Timme  Follow me on Twitter
Wireshark is a network protocol analyzer (or "packet sniffer") that can be used for network analysis, troubleshooting, software development, education, etc. This guide shows how to install and use it on an Ubuntu 9.10 desktop to analyze the traffic on the local network card.
This document comes without warranty of any kind! I do not issue any guarantee that this will work for you!
1 Installing Wireshark
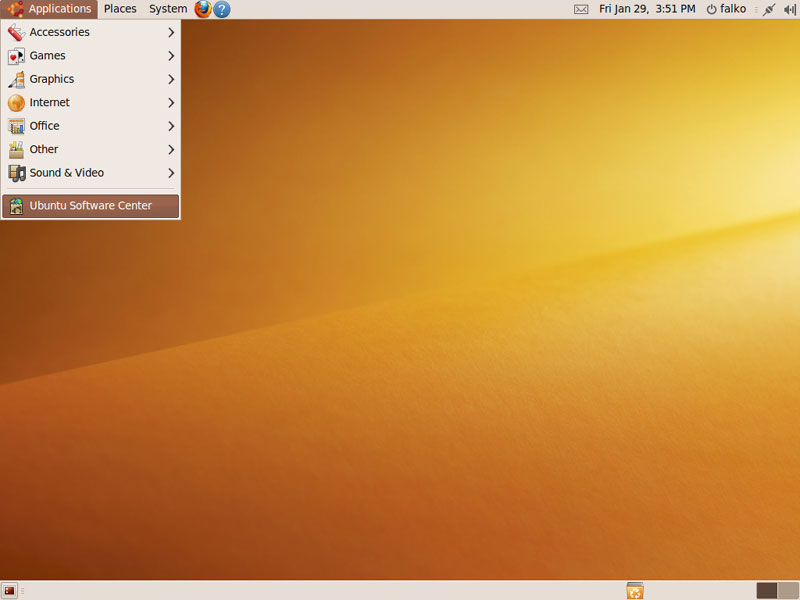
Go to Applications > Ubuntu Software Center...
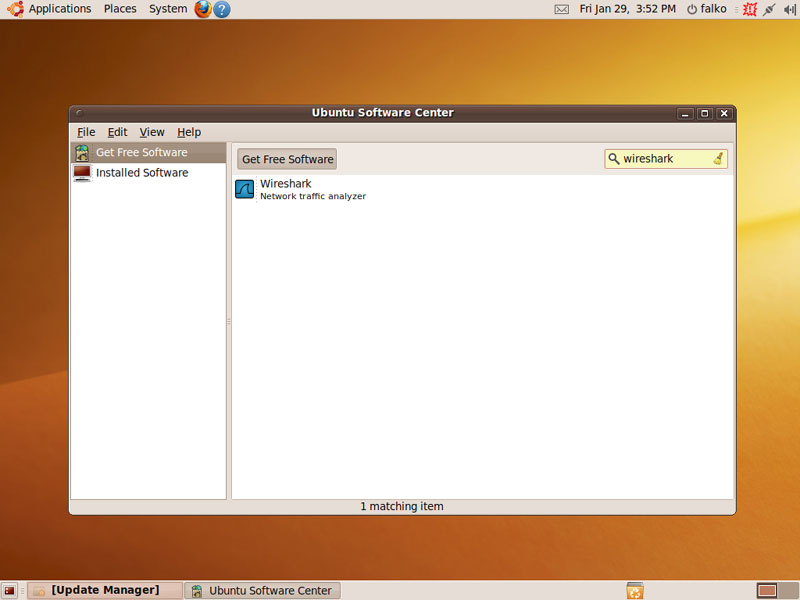
... and search for wireshark:
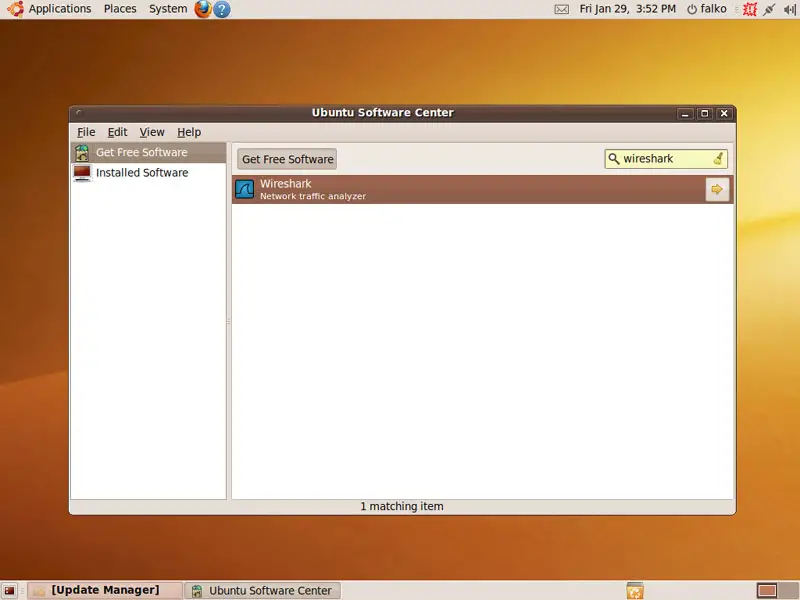
Mark the Wireshark package and click on the arrow on the right:
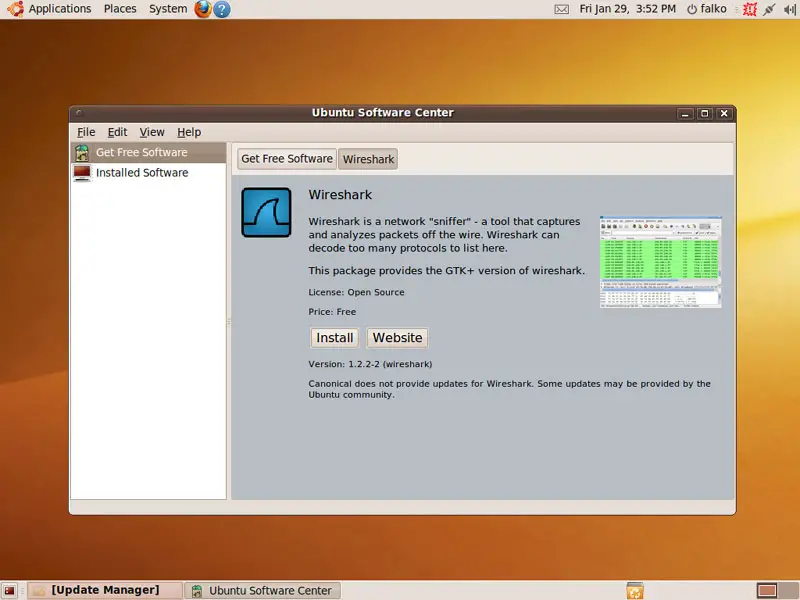
On the next screen, click the Install button:
Type in your password:
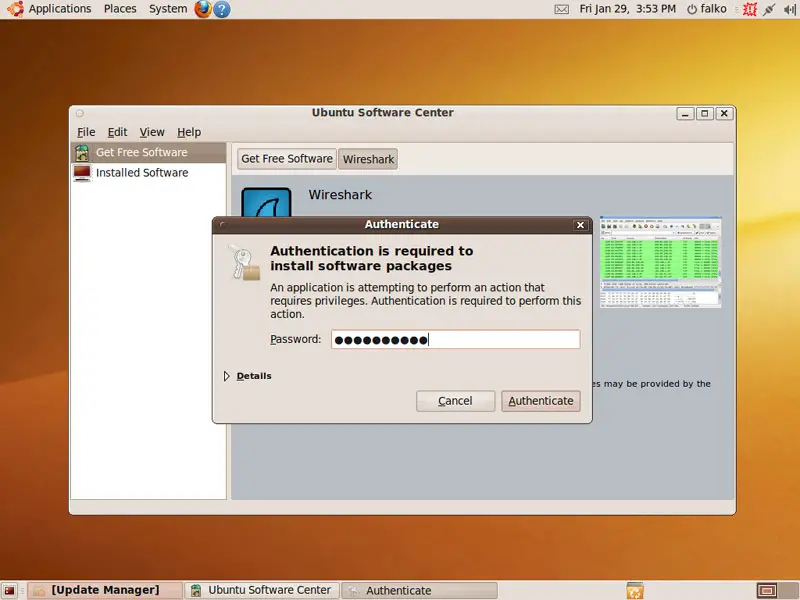
Wireshark is now being downloaded and installed:
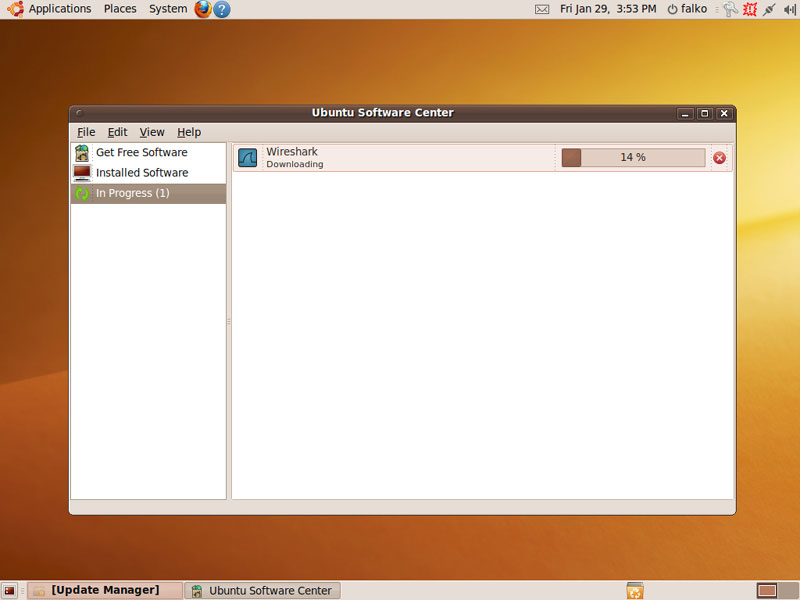
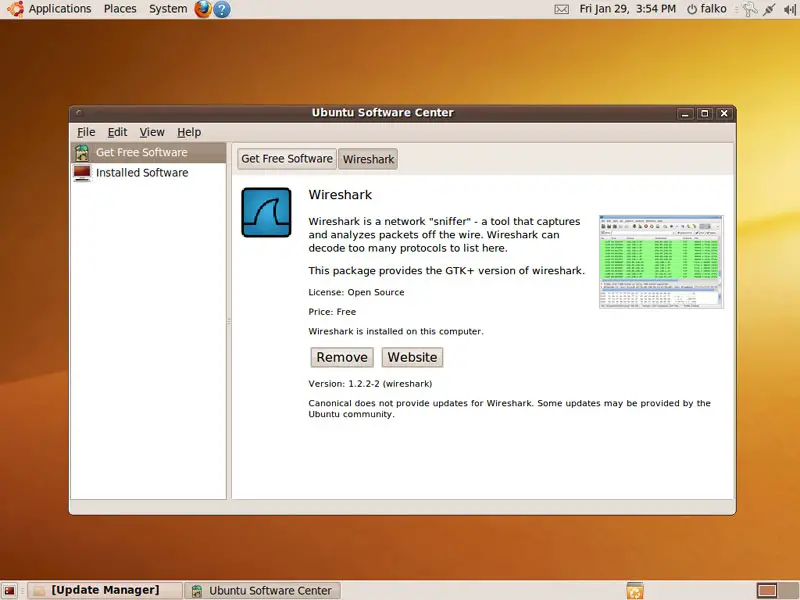
You can close the Ubuntu Software Center window afterwards:
2 Using Wireshark
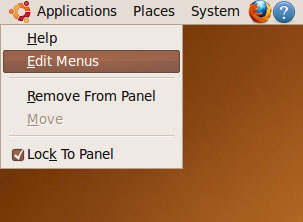
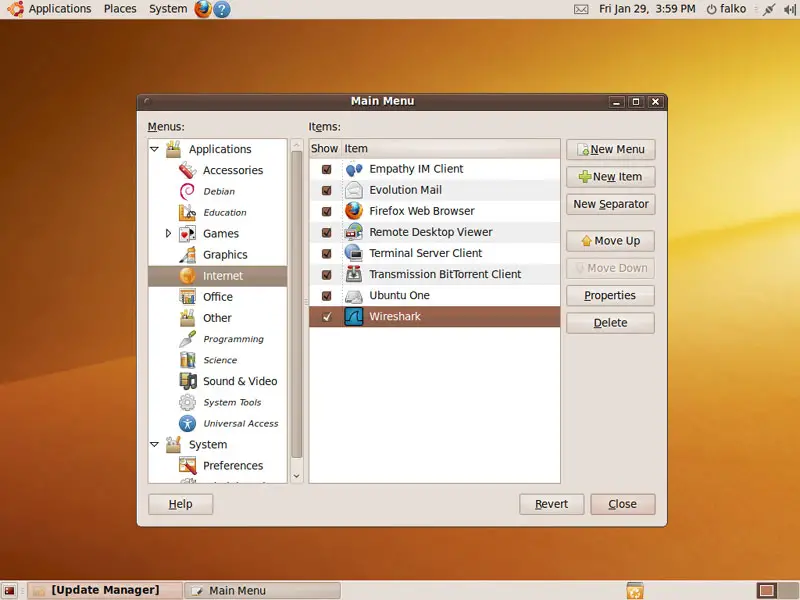
We must run Wireshark with root privileges so that it has enough permissions to monitor the network interfaces. Because the default Wireshark launcher starts Wireshark with normal user privileges, we have to modify the launcher now. Right-click Applications and select Edit Menus:
In the Menu Editor, go to Internet > Wireshark and click the Properties button:
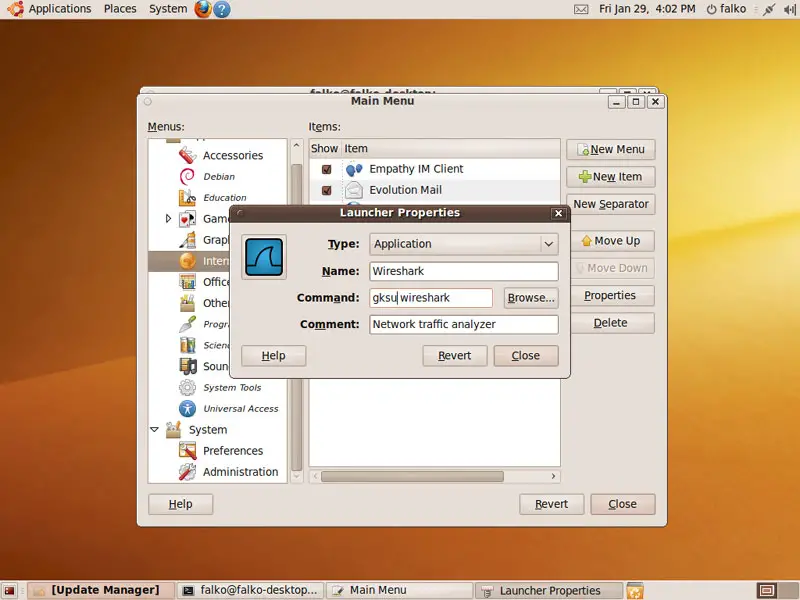
In the Launcher Properties window, add gksu in the Command field so that the command reads gksu wireshark. Click Close afterwards and leave the Menu Editor:
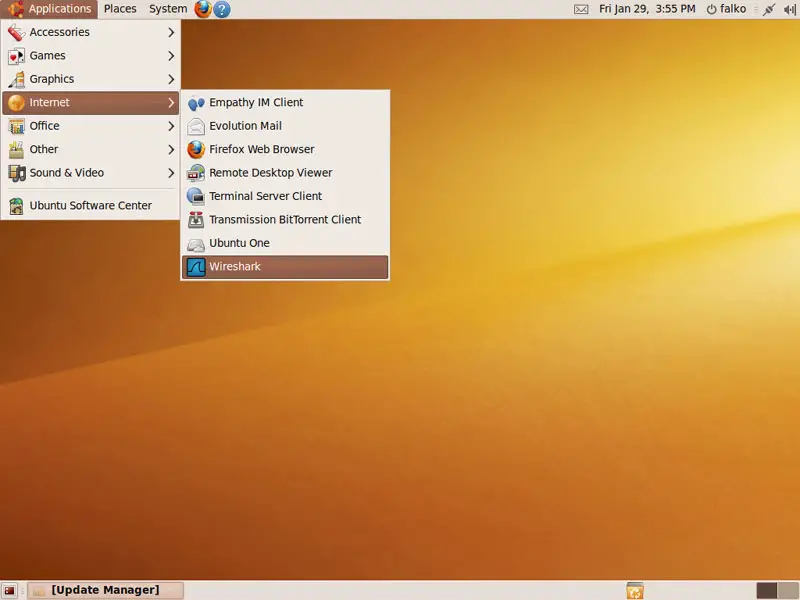
Open the Wireshark application (Applications > Internet > Wireshark):
Because we are running Wireshark with root privileges, you will see the following warning (Running as user "root" and group "root". This could be dangerous.). Click OK:
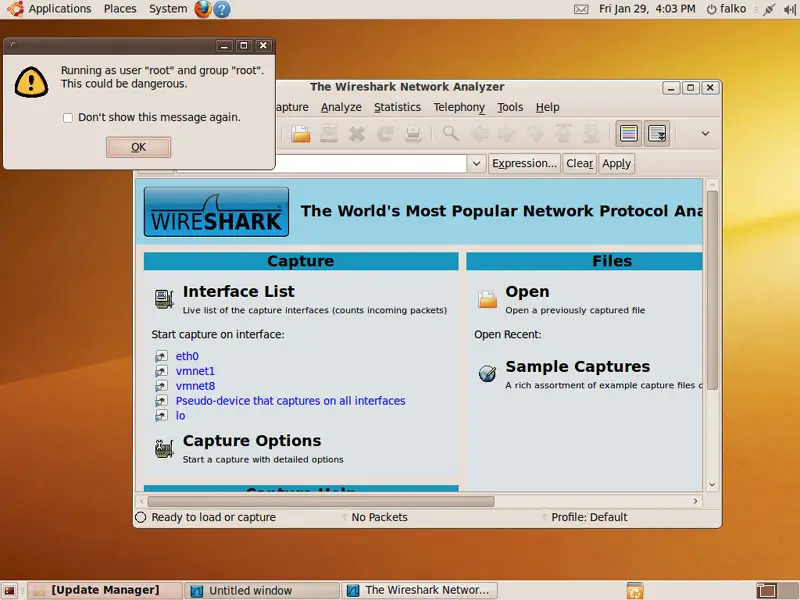
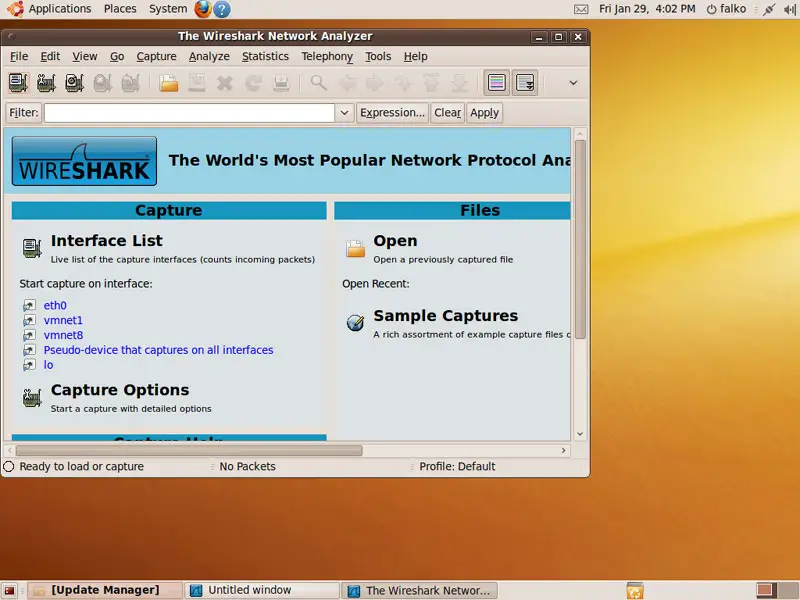
This is how Wireshark looks when you first start it:
Click the List the available capture interfaces... button:
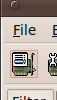
A new window opens with a list of available network interfaces on your system. Normally you want to capture the traffic on your primary network device (eth0 in this example), so you click the Start button in the eth0 row to start an analysis of the traffic on that interface:
You can now see the captured packets for various protocols in the main window.
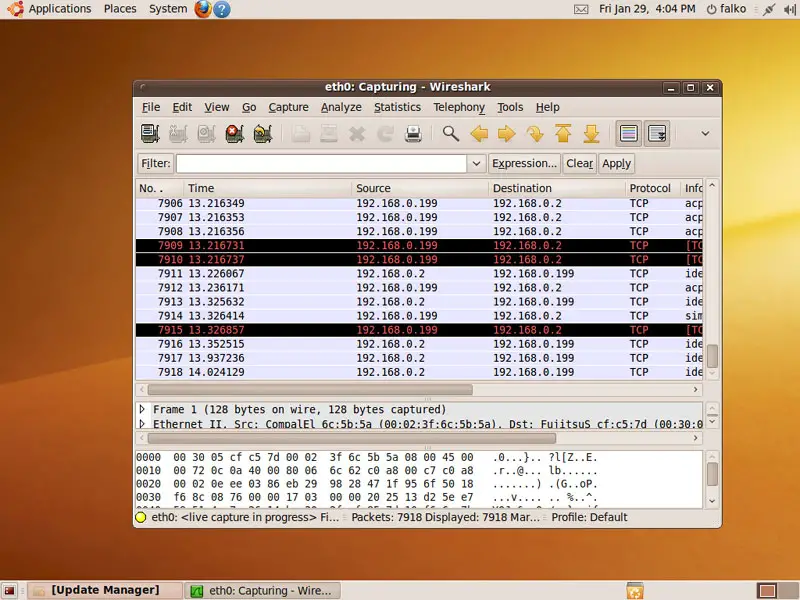
The capture goes on until you click the Stop button:

You can now browse the results, apply filters, find problems, etc.
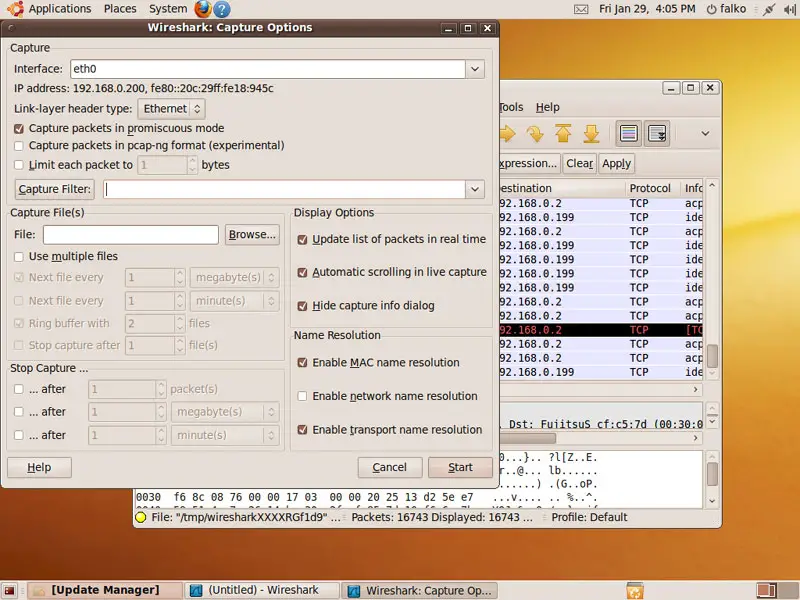
To fine-tune future captures, you can click the Show the capture options... button:

A new window opens where you can set parameters for the next capture. Click Start afterwards to start the capture:
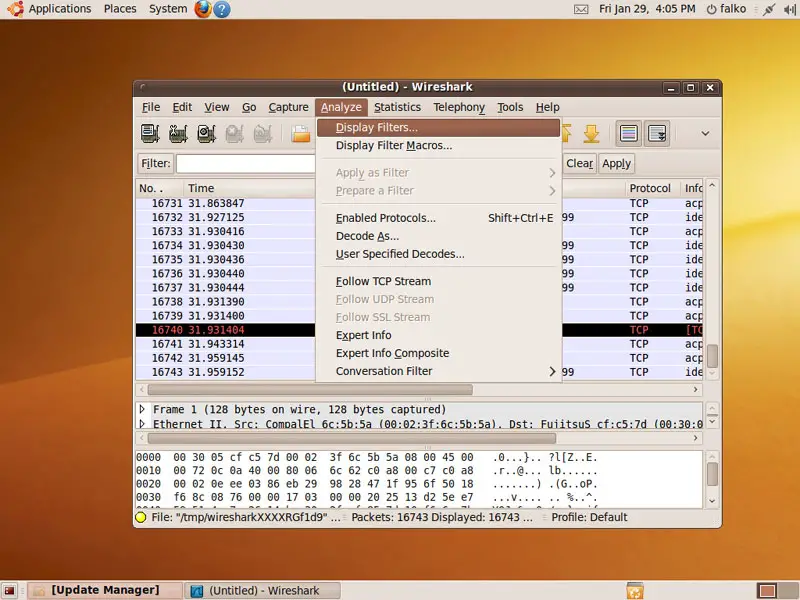
The result of a capture lists all found protocols by default. If you'd like to concentrate on a certain protocol (for example), you can apply a filter to the result. Go to Analyze > Display Filters...:
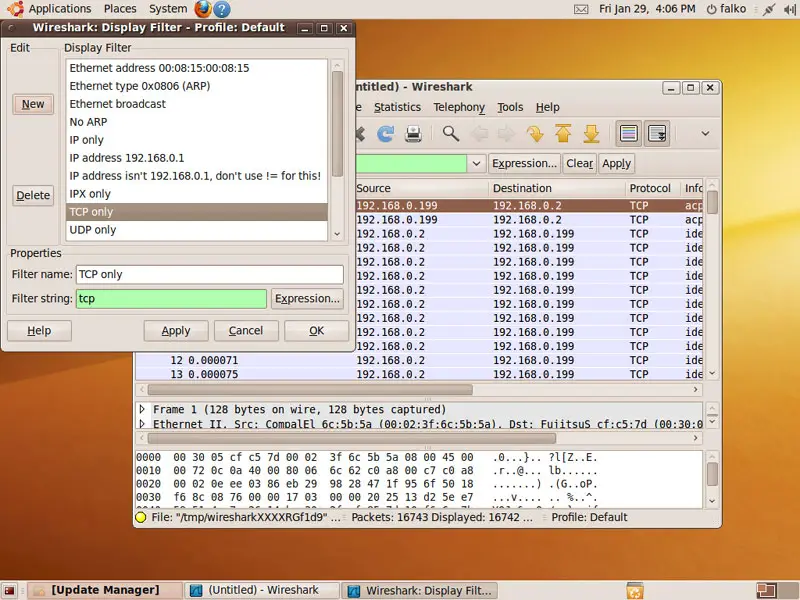
A new window opens where you can select your desired protocol (TCP for example). Click OK afterwards:
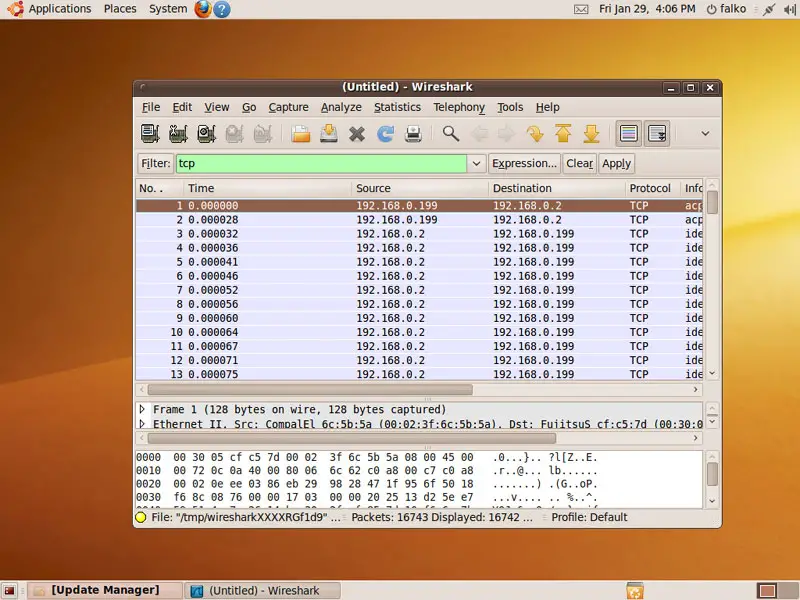
In the result window, you should now find TCP traffic only - all other protocols have been filtered out:
To learn more about Wireshark usage, how to read the results, etc., take a look at the Wireshark documentation.
3 Links
- Wireshark: http://www.wireshark.org/
- Ubuntu: http://www.ubuntu.com/

