Linux Tutorials on the topic “monitoring”
-
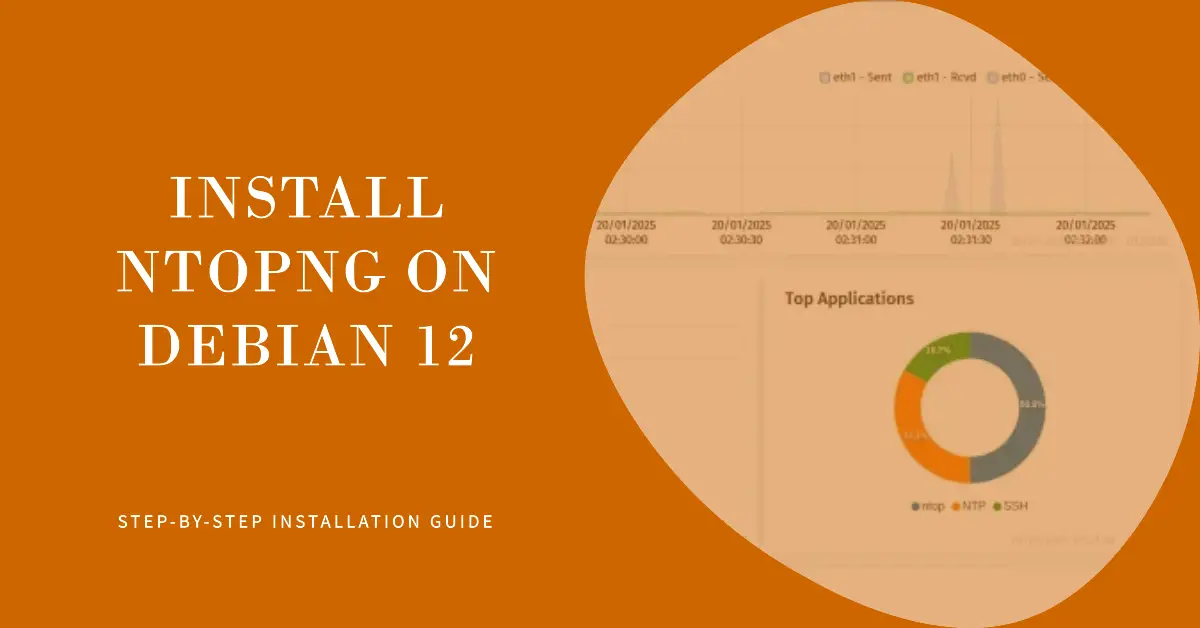
How to Install ntopng on Debian 12
Author: Arvid L • Tags: debian, linux, monitoring, server • Comments: 0 • Published: Feb 24, 2025Ntopng is an open-source network traffic monitoring tool for traffic analysis and real-time visualization. In this tutorial, you'll learn how to install the Ntopng Network Monitoring Tool on the Debian 12 server.
-
How to Install Zabbix on Debian 12 Server
Author: Arvid L • Tags: debian, linux, monitoring, server, web server • Comments: 0 • Published: Jan 02, 2025Zabbix is a free and open-source monitoring solution for IT infrastructure. It allows you to monitor networks, servers, virtual machines, and cloud services.
-
How to Install Sysdig to Monitor System Load on Ubuntu 24.04
Author: Hitesh Jethva • Tags: linux, monitoring, ubuntu • Comments: 0 • Updated: Aug 23, 2024Sysdig is an open-source and comprehensive activity monitoring tool for Linux. It is used to capture and analyze application logs and helps you to troubleshoot system-related issues. In this post, we will show you how to install and use the Sysdig monitoring tool on Linux.
-
-

How to Install and Use iostat on Ubuntu
Author: Hitesh Jethva • Tags: linux, monitoring, ubuntu • Comments: 0 • Updated: Aug 10, 2024iostat, also known as input/output statistics, is a popular Linux system monitoring tool that can be used to collect statistics of input and output devices. It allows users to identify performance issues of local disk, remote disk, and system information. This tutorial will teach us how to install and use iostat on Ubuntu.
-

How to Install Matomo Web Analytics on Debian 12
Author: Arvid L • Tags: debian, linux, monitoring, server, web server • Comments: 0Matomo, formerly Piwik, is free and open-source web analytics software that can be used to track website visits and display reports for data and audience analysis.
-
How to Install Grafana and Prometheus on Ubuntu 24.04
Author: Arvid L • Tags: linux, monitoring, ubuntu • Comments: 0Grafana is an open-source and multi-platform data visualization platform. In this tutorial, you’ll learn how to install Grafana, Prometheus, and node_exporter on Ubuntu 24.04 servers.
-

How to Install and Configure Suricata IDS along with Elastic Stack on Rocky Linux 9
Author: Navjot Singh • Tags: linux, monitoring, security, server • Comments: 0Suricata is a Network Monitoring tool that examines and processes every packet of internet traffic that flows through your server. It can generate log events, trigger alerts, and drop traffic upon detecting any suspicious activity.
-
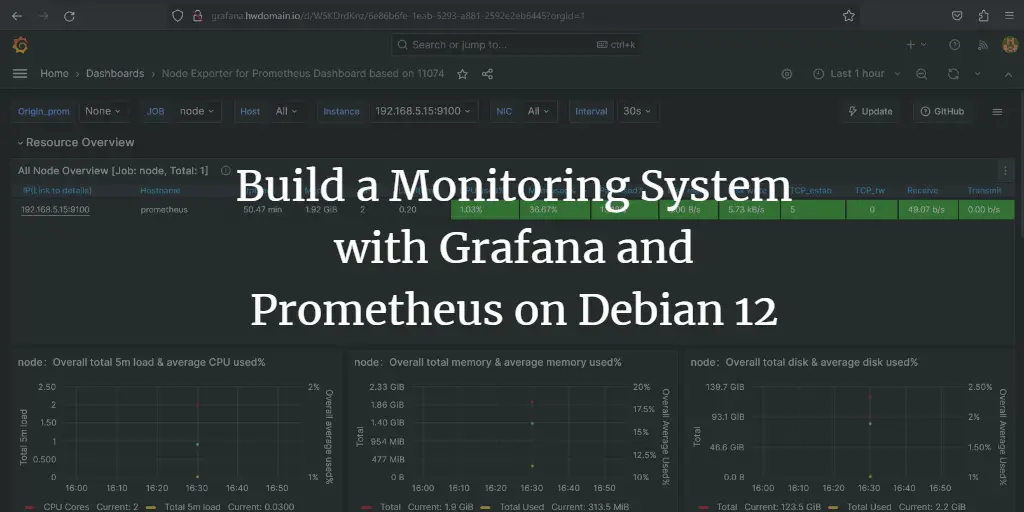
Build a Monitoring System with Grafana and Prometheus on Debian 12
Author: Arvid L • Tags: debian, linux, monitoring, server • Comments: 0Grafana is an open-source and multi-platform data visualization platform developed by Grafana Labs. In this guide, you will install Grafana on the Debian 12 server with Nginx as a reverse proxy, then add Prometheus as the data source and configure the Grafana Dashboard for system monitoring.
-
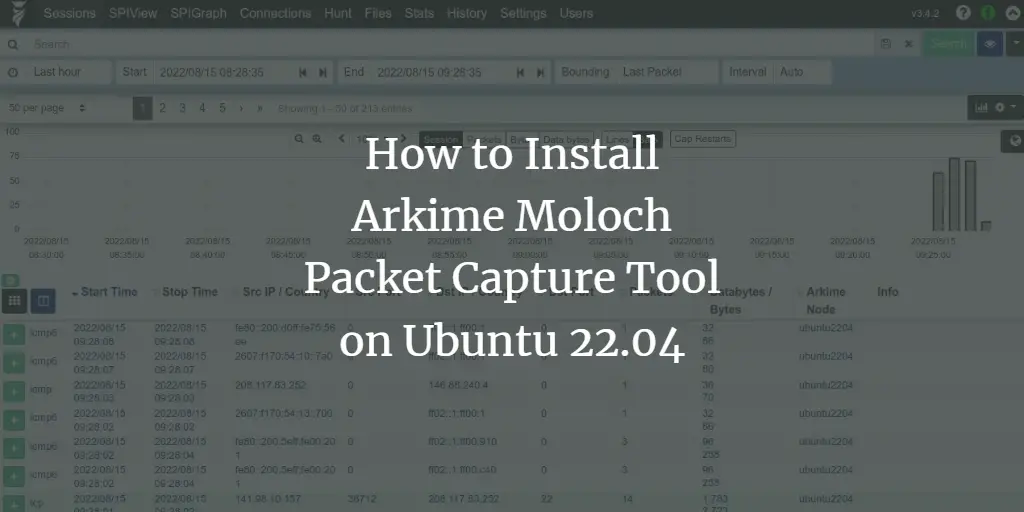
How to Install Arkime Moloch Packet Capture Tool on Ubuntu 22.04
Author: Hitesh Jethva • Tags: monitoring, networking, security, server, ubuntu • Comments: 0Arkime is a free, open-source, large-scale indexed packet capture and search tool that stores and indexes network traffic in PCAP format. This tutorial will show you how to install the Arkime Packet Capture tool on Ubuntu 22.04.
-
Install and Configure OpenNMS on Alma Linux 8
Author: Hitesh Jethva • Tags: linux, monitoring • Comments: 0OpenNMS is a free and open-source network monitoring and management platform written in Java. This post will show you how to install OpenNMS with Nginx on Alma Linux 8.
